29
/pt/
pt
AIzaSyAYiBZKx7MnpbEhh9jyipgxe19OcubqV5w
April 1, 2024
225281
Poland
POL
true
2
1
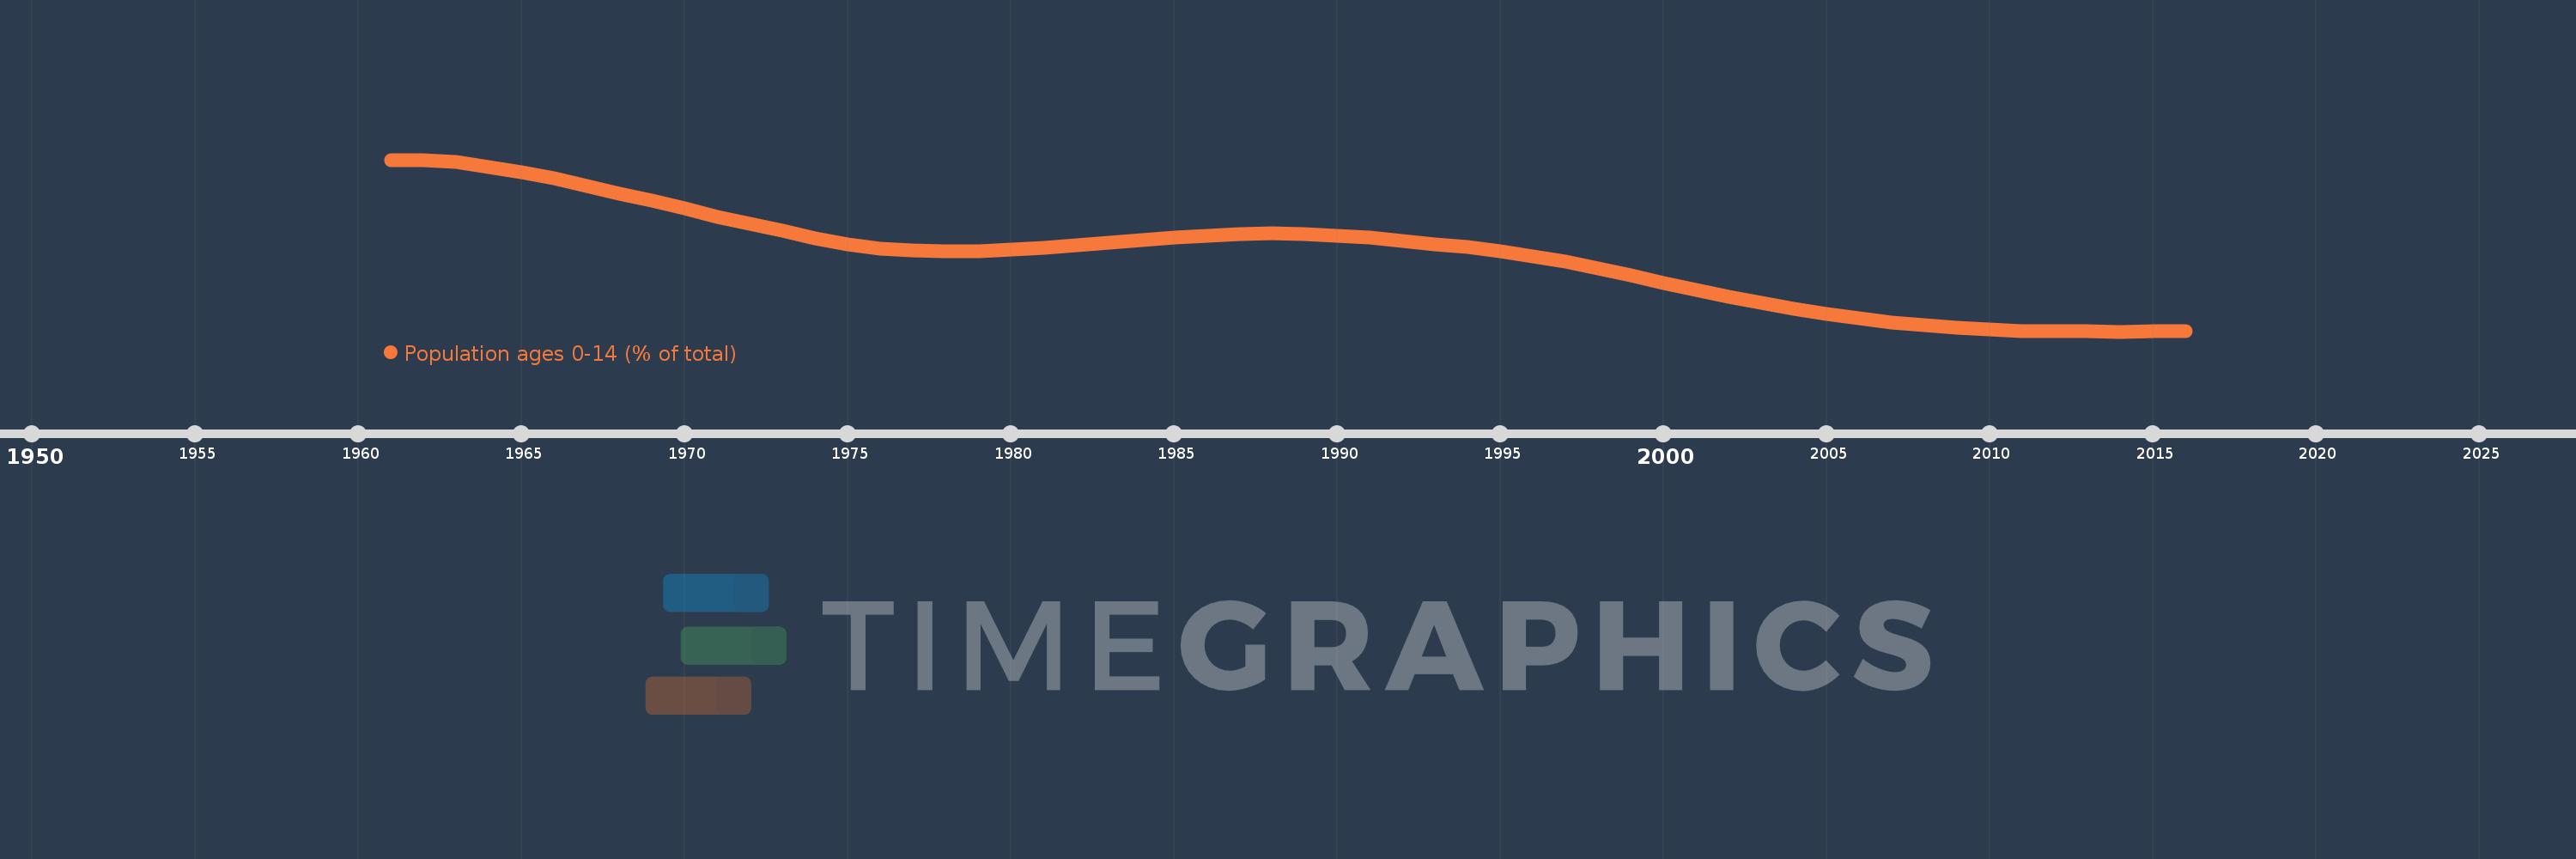
Population ages 0-14 (% of total)
2016,2015,2014,2013,2012,2011,2010,2009,2008,2007,2006,2005,2004,2003,2002,2001,2000,1999,1998,1997,1996,1995,1994,1993,1992,1991,1990,1989,1988,1987,1986,1985,1984,1983,1982,1981,1980,1979,1978,1977,1976,1975,1974,1973,1972,1971,1970,1969,1968,1967,1966,1965,1964,1963,1962,1961
Estas estatísticas em outros países:
AfghanistanAlbaniaAlgeriaAngolaAntigua and BarbudaArab WorldArgentinaArmeniaArubaAustraliaAustriaAzerbaijanBahamas, TheBahrainBangladeshBarbadosBelarusBelgiumBelizeBeninBhutanBoliviaBosnia and HerzegovinaBotswanaBrazilBrunei DarussalamBulgariaBurkina FasoBurundiCabo VerdeCambodiaCameroonCanadaCaribbean small statesCentral African RepublicCentral Europe and the BalticsChadChannel IslandsChileChinaColombiaComorosCongo, Dem. Rep.Congo, Rep.Costa RicaCote d'IvoireCroatiaCubaCuracaoCyprusCzech RepublicDenmarkDjiboutiDominican RepublicEarly-demographic dividendEast Asia & PacificEast Asia & Pacific (excluding high income)East Asia & Pacific (IDA & IBRD countries)EcuadorEgypt, Arab Rep.El SalvadorEquatorial GuineaEritreaEstoniaEthiopiaEuro areaEurope & Central AsiaEurope & Central Asia (excluding high income)Europe & Central Asia (IDA & IBRD countries)European UnionFijiFinlandFragile and conflict affected situationsFranceFrench PolynesiaGabonGambia, TheGeorgiaGermanyGhanaGreeceGrenadaGuamGuatemalaGuineaGuinea-BissauGuyanaHaitiHeavily indebted poor countries (HIPC)High incomeHondurasHong Kong SAR, ChinaHungaryIBRD onlyIcelandIDA & IBRD totalIDA blendIDA onlyIDA totalIndiaIndonesiaIran, Islamic Rep.IraqIrelandIsraelItalyJamaicaJapanJordanKazakhstanKenyaKiribatiKorea, Dem. People’s Rep.Korea, Rep.KosovoKuwaitKyrgyz RepublicLao PDRLate-demographic dividendLatin America & Caribbean Latin America & Caribbean (excluding high income)Latin America & the Caribbean (IDA & IBRD countries)LatviaLeast developed countries: UN classificationLebanonLesothoLiberiaLibyaLithuaniaLow & middle incomeLow incomeLower middle incomeLuxembourgMacao SAR, ChinaMacedonia, FYRMadagascarMalawiMalaysiaMaldivesMaliMaltaMauritaniaMauritiusMexicoMicronesia, Fed. Sts.Middle East & North AfricaMiddle East & North Africa (excluding high income)Middle East & North Africa (IDA & IBRD countries)Middle incomeMoldovaMongoliaMontenegroMoroccoMozambiqueMyanmarNamibiaNepalNetherlandsNew CaledoniaNew ZealandNicaraguaNigerNigeriaNorth AmericaNorwayOECD membersOmanOther small statesPacific island small statesPakistanPanamaPapua New GuineaParaguayPeruPhilippinesPolandPortugalPost-demographic dividendPre-demographic dividendPuerto RicoQatarRomaniaRussian FederationRwandaSamoaSao Tome and PrincipeSaudi ArabiaSenegalSerbiaSeychellesSierra LeoneSingaporeSlovak RepublicSloveniaSmall statesSolomon IslandsSomaliaSouth AfricaSouth AsiaSouth Asia (IDA & IBRD)South SudanSpainSri LankaSt. LuciaSt. Vincent and the GrenadinesSub-Saharan Africa Sub-Saharan Africa (excluding high income)Sub-Saharan Africa (IDA & IBRD countries)SudanSurinameSwazilandSwedenSwitzerlandSyrian Arab RepublicTajikistanTanzaniaThailandTimor-LesteTogoTongaTrinidad and TobagoTunisiaTurkeyTurkmenistanUgandaUkraineUnited Arab EmiratesUnited KingdomUnited StatesUpper middle incomeUruguayUzbekistanVanuatuVenezuela, RBVietnamVirgin Islands (U.S.)West Bank and GazaWorldYemen, Rep.ZambiaZimbabwe Linha do tempo:
Nesta escala de tempo está apresentado um gráfico de 1961 ano até 2016 ano Poland. Dados de 1960 ano ausente. O número de observações reais por data: 56.
Fonte (nome):
Indicadores de desenvolvimento mundial
Fonte (organização):
World Bank staff estimates based on age distributions of United Nations Population Division's World Population Prospects.
Categorias:
Education, Health
Foi atualizado:
23 abr 2017 ano
Indicadores de alterações dos valores ao longo dos anos
Mínimo:
14.879
1 jan 2014 ano
Máximo:
33.732
1 jan 1962 ano
Na data de observação
Valor
Mudança absoluta
A alteração em relação ao valor anterior
1 jan 1961 ano
33.681
+33.681
0.0%
1 jan 1962 ano
33.732
+0.051
0.15%
1 jan 1963 ano
33.475
-0.257
-0.76%
1 jan 1964 ano
32.974
-0.501
-1.5%
1 jan 1965 ano
32.365
-0.609
-1.85%
1 jan 1966 ano
31.724
-0.64
-1.98%
1 jan 1967 ano
30.834
-0.89
-2.81%
1 jan 1968 ano
30.027
-0.807
-2.62%
1 jan 1969 ano
29.242
-0.786
-2.62%
1 jan 1970 ano
28.395
-0.847
-2.9%
1 jan 1971 ano
27.475
-0.919
-3.24%
1 jan 1972 ano
26.725
-0.75
-2.73%
1 jan 1973 ano
25.918
-0.807
-3.02%
1 jan 1974 ano
25.127
-0.791
-3.05%
1 jan 1975 ano
24.462
-0.664
-2.64%
1 jan 1976 ano
23.983
-0.479
-1.96%
1 jan 1977 ano
23.777
-0.206
-0.86%
1 jan 1978 ano
23.69
-0.087
-0.37%
1 jan 1979 ano
23.727
+0.037
0.16%
1 jan 1980 ano
23.862
+0.135
0.57%
1 jan 1981 ano
24.067
+0.205
0.86%
1 jan 1982 ano
24.307
+0.24
1.0%
1 jan 1983 ano
24.616
+0.309
1.27%
1 jan 1984 ano
24.951
+0.334
1.36%
1 jan 1985 ano
25.239
+0.289
1.16%
1 jan 1986 ano
25.431
+0.192
0.76%
1 jan 1987 ano
25.61
+0.179
0.7%
1 jan 1988 ano
25.645
+0.035
0.14%
1 jan 1989 ano
25.555
-0.09
-0.35%
1 jan 1990 ano
25.394
-0.162
-0.63%
1 jan 1991 ano
25.194
-0.2
-0.79%
1 jan 1992 ano
24.83
-0.364
-1.45%
1 jan 1993 ano
24.493
-0.337
-1.36%
1 jan 1994 ano
24.139
-0.354
-1.45%
1 jan 1995 ano
23.693
-0.446
-1.85%
1 jan 1996 ano
23.122
-0.571
-2.41%
1 jan 1997 ano
22.554
-0.569
-2.46%
1 jan 1998 ano
21.84
-0.714
-3.17%
1 jan 1999 ano
21.03
-0.81
-3.71%
1 jan 2000 ano
20.219
-0.811
-3.86%
1 jan 2001 ano
19.466
-0.753
-3.72%
1 jan 2002 ano
18.692
-0.774
-3.98%
1 jan 2003 ano
18.0
-0.693
-3.71%
1 jan 2004 ano
17.385
-0.615
-3.42%
1 jan 2005 ano
16.826
-0.559
-3.21%
1 jan 2006 ano
16.321
-0.505
-3.0%
1 jan 2007 ano
15.899
-0.422
-2.58%
1 jan 2008 ano
15.569
-0.33
-2.07%
1 jan 2009 ano
15.318
-0.251
-1.61%
1 jan 2010 ano
15.121
-0.197
-1.29%
1 jan 2011 ano
14.96
-0.161
-1.07%
1 jan 2012 ano
14.962
+0.002
0.01%
1 jan 2013 ano
14.922
-0.04
-0.27%
1 jan 2014 ano
14.879
-0.042
-0.28%
1 jan 2015 ano
14.883
+0.004
0.03%
1 jan 2016 ano
14.946
+0.063
0.42%
Classificação de países por estatísticas atuais por anos


Comentários: