29
/pt/
pt
AIzaSyAYiBZKx7MnpbEhh9jyipgxe19OcubqV5w
April 1, 2024
260066
Tajikistan
TJK
true
2
1
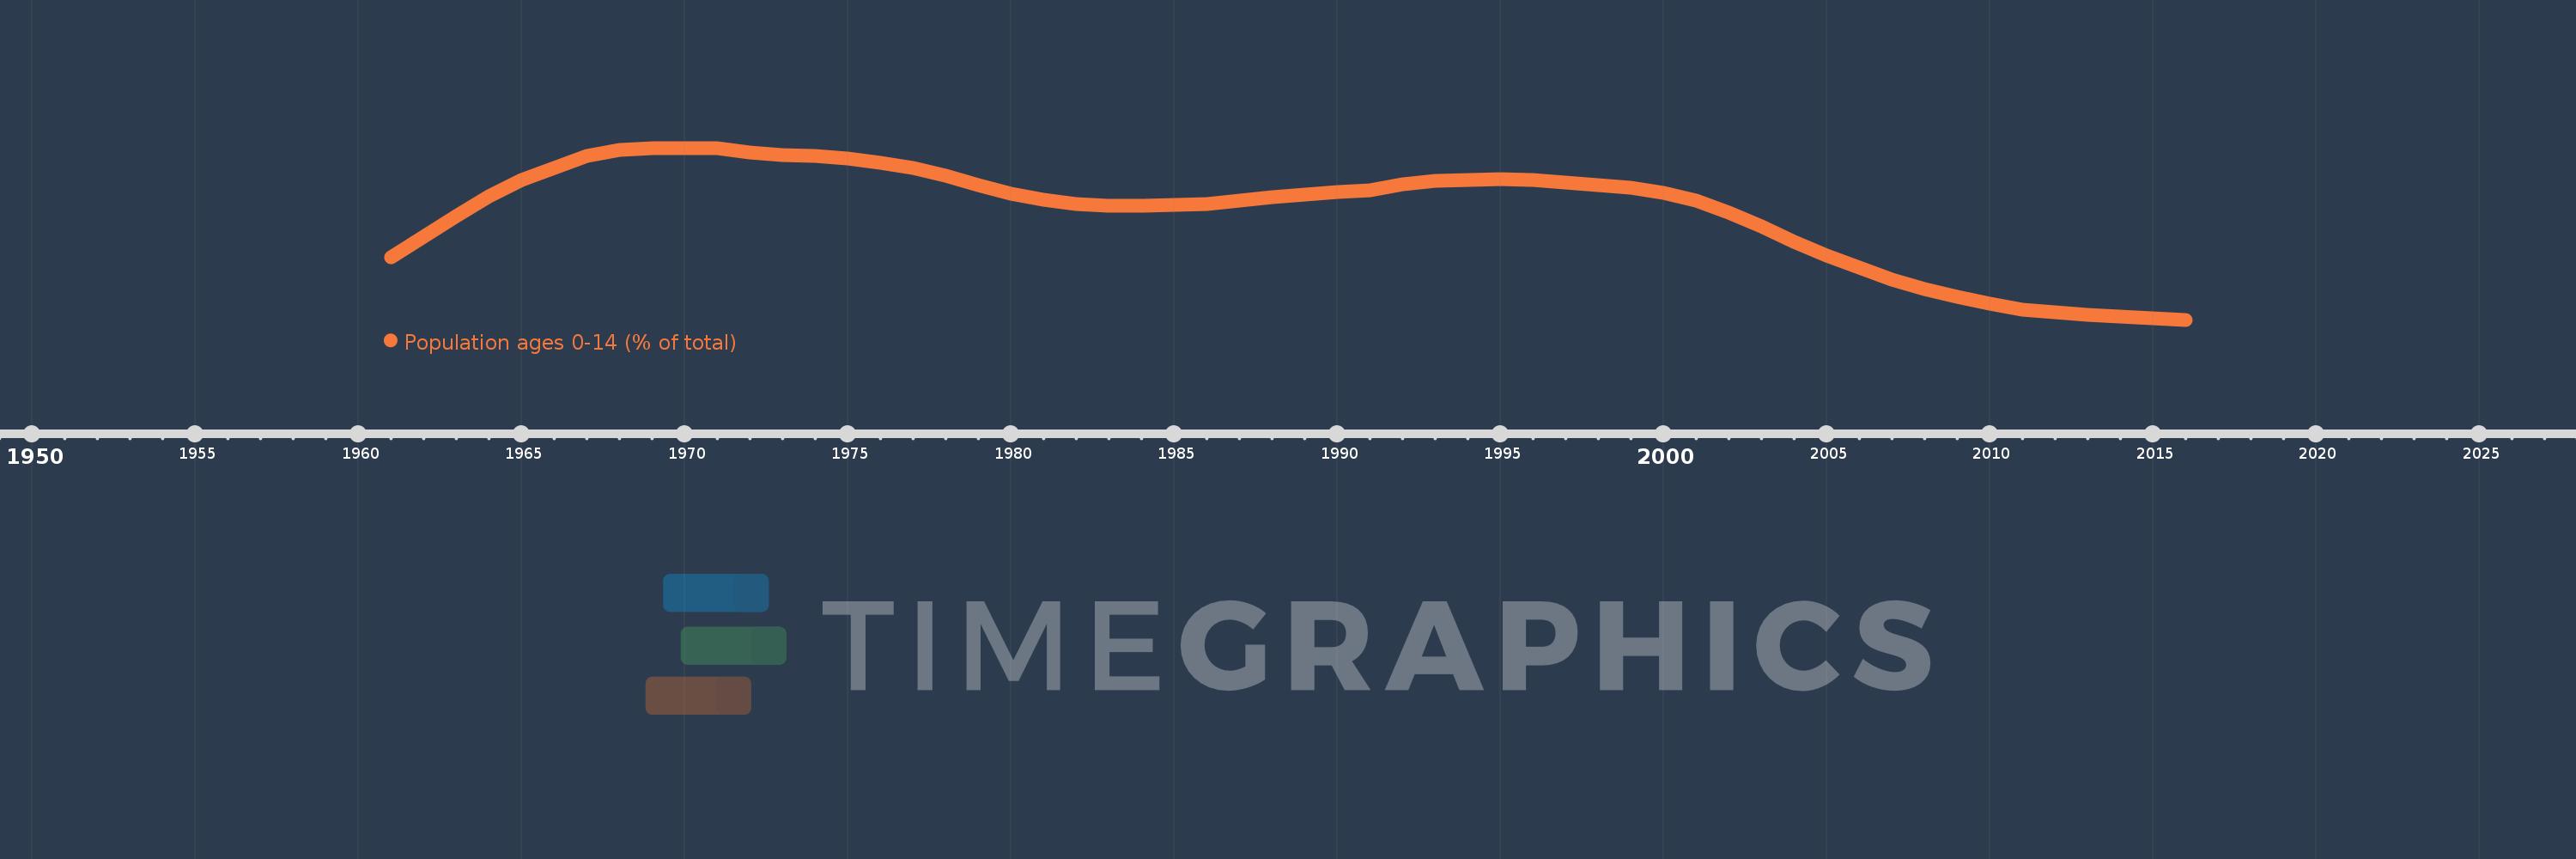
Population ages 0-14 (% of total)
2016,2015,2014,2013,2012,2011,2010,2009,2008,2007,2006,2005,2004,2003,2002,2001,2000,1999,1998,1997,1996,1995,1994,1993,1992,1991,1990,1989,1988,1987,1986,1985,1984,1983,1982,1981,1980,1979,1978,1977,1976,1975,1974,1973,1972,1971,1970,1969,1968,1967,1966,1965,1964,1963,1962,1961
Estas estatísticas em outros países:
AfghanistanAlbaniaAlgeriaAngolaAntigua and BarbudaArab WorldArgentinaArmeniaArubaAustraliaAustriaAzerbaijanBahamas, TheBahrainBangladeshBarbadosBelarusBelgiumBelizeBeninBhutanBoliviaBosnia and HerzegovinaBotswanaBrazilBrunei DarussalamBulgariaBurkina FasoBurundiCabo VerdeCambodiaCameroonCanadaCaribbean small statesCentral African RepublicCentral Europe and the BalticsChadChannel IslandsChileChinaColombiaComorosCongo, Dem. Rep.Congo, Rep.Costa RicaCote d'IvoireCroatiaCubaCuracaoCyprusCzech RepublicDenmarkDjiboutiDominican RepublicEarly-demographic dividendEast Asia & PacificEast Asia & Pacific (excluding high income)East Asia & Pacific (IDA & IBRD countries)EcuadorEgypt, Arab Rep.El SalvadorEquatorial GuineaEritreaEstoniaEthiopiaEuro areaEurope & Central AsiaEurope & Central Asia (excluding high income)Europe & Central Asia (IDA & IBRD countries)European UnionFijiFinlandFragile and conflict affected situationsFranceFrench PolynesiaGabonGambia, TheGeorgiaGermanyGhanaGreeceGrenadaGuamGuatemalaGuineaGuinea-BissauGuyanaHaitiHeavily indebted poor countries (HIPC)High incomeHondurasHong Kong SAR, ChinaHungaryIBRD onlyIcelandIDA & IBRD totalIDA blendIDA onlyIDA totalIndiaIndonesiaIran, Islamic Rep.IraqIrelandIsraelItalyJamaicaJapanJordanKazakhstanKenyaKiribatiKorea, Dem. People’s Rep.Korea, Rep.KosovoKuwaitKyrgyz RepublicLao PDRLate-demographic dividendLatin America & Caribbean Latin America & Caribbean (excluding high income)Latin America & the Caribbean (IDA & IBRD countries)LatviaLeast developed countries: UN classificationLebanonLesothoLiberiaLibyaLithuaniaLow & middle incomeLow incomeLower middle incomeLuxembourgMacao SAR, ChinaMacedonia, FYRMadagascarMalawiMalaysiaMaldivesMaliMaltaMauritaniaMauritiusMexicoMicronesia, Fed. Sts.Middle East & North AfricaMiddle East & North Africa (excluding high income)Middle East & North Africa (IDA & IBRD countries)Middle incomeMoldovaMongoliaMontenegroMoroccoMozambiqueMyanmarNamibiaNepalNetherlandsNew CaledoniaNew ZealandNicaraguaNigerNigeriaNorth AmericaNorwayOECD membersOmanOther small statesPacific island small statesPakistanPanamaPapua New GuineaParaguayPeruPhilippinesPolandPortugalPost-demographic dividendPre-demographic dividendPuerto RicoQatarRomaniaRussian FederationRwandaSamoaSao Tome and PrincipeSaudi ArabiaSenegalSerbiaSeychellesSierra LeoneSingaporeSlovak RepublicSloveniaSmall statesSolomon IslandsSomaliaSouth AfricaSouth AsiaSouth Asia (IDA & IBRD)South SudanSpainSri LankaSt. LuciaSt. Vincent and the GrenadinesSub-Saharan Africa Sub-Saharan Africa (excluding high income)Sub-Saharan Africa (IDA & IBRD countries)SudanSurinameSwazilandSwedenSwitzerlandSyrian Arab RepublicTajikistanTanzaniaThailandTimor-LesteTogoTongaTrinidad and TobagoTunisiaTurkeyTurkmenistanUgandaUkraineUnited Arab EmiratesUnited KingdomUnited StatesUpper middle incomeUruguayUzbekistanVanuatuVenezuela, RBVietnamVirgin Islands (U.S.)West Bank and GazaWorldYemen, Rep.ZambiaZimbabwe Linha do tempo:
Nesta escala de tempo está apresentado um gráfico de 1961 ano até 2016 ano Tajikistan. Dados de 1960 ano ausente. O número de observações reais por data: 56.
Fonte (nome):
Indicadores de desenvolvimento mundial
Fonte (organização):
World Bank staff estimates based on age distributions of United Nations Population Division's World Population Prospects.
Categorias:
Education, Health
Foi atualizado:
23 abr 2017 ano
Indicadores de alterações dos valores ao longo dos anos
Mínimo:
34.838
1 jan 2016 ano
Máximo:
46.477
1 jan 1971 ano
Na data de observação
Valor
Mudança absoluta
A alteração em relação ao valor anterior
1 jan 1961 ano
39.056
+39.056
0.0%
1 jan 1962 ano
40.45
+1.394
3.57%
1 jan 1963 ano
41.871
+1.421
3.51%
1 jan 1964 ano
43.215
+1.345
3.21%
1 jan 1965 ano
44.335
+1.12
2.59%
1 jan 1966 ano
45.15
+0.815
1.84%
1 jan 1967 ano
45.942
+0.792
1.75%
1 jan 1968 ano
46.338
+0.396
0.86%
1 jan 1969 ano
46.456
+0.117
0.25%
1 jan 1970 ano
46.469
+0.013
0.03%
1 jan 1971 ano
46.477
+0.008
0.02%
1 jan 1972 ano
46.153
-0.324
-0.7%
1 jan 1973 ano
45.99
-0.163
-0.35%
1 jan 1974 ano
45.916
-0.074
-0.16%
1 jan 1975 ano
45.769
-0.146
-0.32%
1 jan 1976 ano
45.459
-0.31
-0.68%
1 jan 1977 ano
45.147
-0.312
-0.69%
1 jan 1978 ano
44.625
-0.522
-1.16%
1 jan 1979 ano
43.985
-0.64
-1.43%
1 jan 1980 ano
43.395
-0.59
-1.34%
1 jan 1981 ano
42.955
-0.441
-1.02%
1 jan 1982 ano
42.652
-0.303
-0.71%
1 jan 1983 ano
42.532
-0.12
-0.28%
1 jan 1984 ano
42.546
+0.014
0.03%
1 jan 1985 ano
42.608
+0.061
0.14%
1 jan 1986 ano
42.673
+0.065
0.15%
1 jan 1987 ano
42.91
+0.237
0.55%
1 jan 1988 ano
43.13
+0.221
0.51%
1 jan 1989 ano
43.337
+0.207
0.48%
1 jan 1990 ano
43.515
+0.178
0.41%
1 jan 1991 ano
43.633
+0.117
0.27%
1 jan 1992 ano
44.016
+0.383
0.88%
1 jan 1993 ano
44.232
+0.217
0.49%
1 jan 1994 ano
44.325
+0.093
0.21%
1 jan 1995 ano
44.349
+0.024
0.05%
1 jan 1996 ano
44.323
-0.026
-0.06%
1 jan 1997 ano
44.134
-0.189
-0.43%
1 jan 1998 ano
43.974
-0.16
-0.36%
1 jan 1999 ano
43.769
-0.205
-0.47%
1 jan 2000 ano
43.419
-0.35
-0.8%
1 jan 2001 ano
42.893
-0.526
-1.21%
1 jan 2002 ano
42.109
-0.784
-1.83%
1 jan 2003 ano
41.159
-0.95
-2.26%
1 jan 2004 ano
40.133
-1.026
-2.49%
1 jan 2005 ano
39.172
-0.961
-2.39%
1 jan 2006 ano
38.352
-0.821
-2.1%
1 jan 2007 ano
37.539
-0.812
-2.12%
1 jan 2008 ano
36.898
-0.641
-1.71%
1 jan 2009 ano
36.386
-0.512
-1.39%
1 jan 2010 ano
35.938
-0.448
-1.23%
1 jan 2011 ano
35.527
-0.411
-1.14%
1 jan 2012 ano
35.347
-0.18
-0.51%
1 jan 2013 ano
35.187
-0.159
-0.45%
1 jan 2014 ano
35.045
-0.143
-0.41%
1 jan 2015 ano
34.926
-0.119
-0.34%
1 jan 2016 ano
34.838
-0.088
-0.25%
Classificação de países por estatísticas atuais por anos


Comentários: