29
/pt/
pt
AIzaSyAYiBZKx7MnpbEhh9jyipgxe19OcubqV5w
April 1, 2024
207240
Nepal
NPL
true
2
1
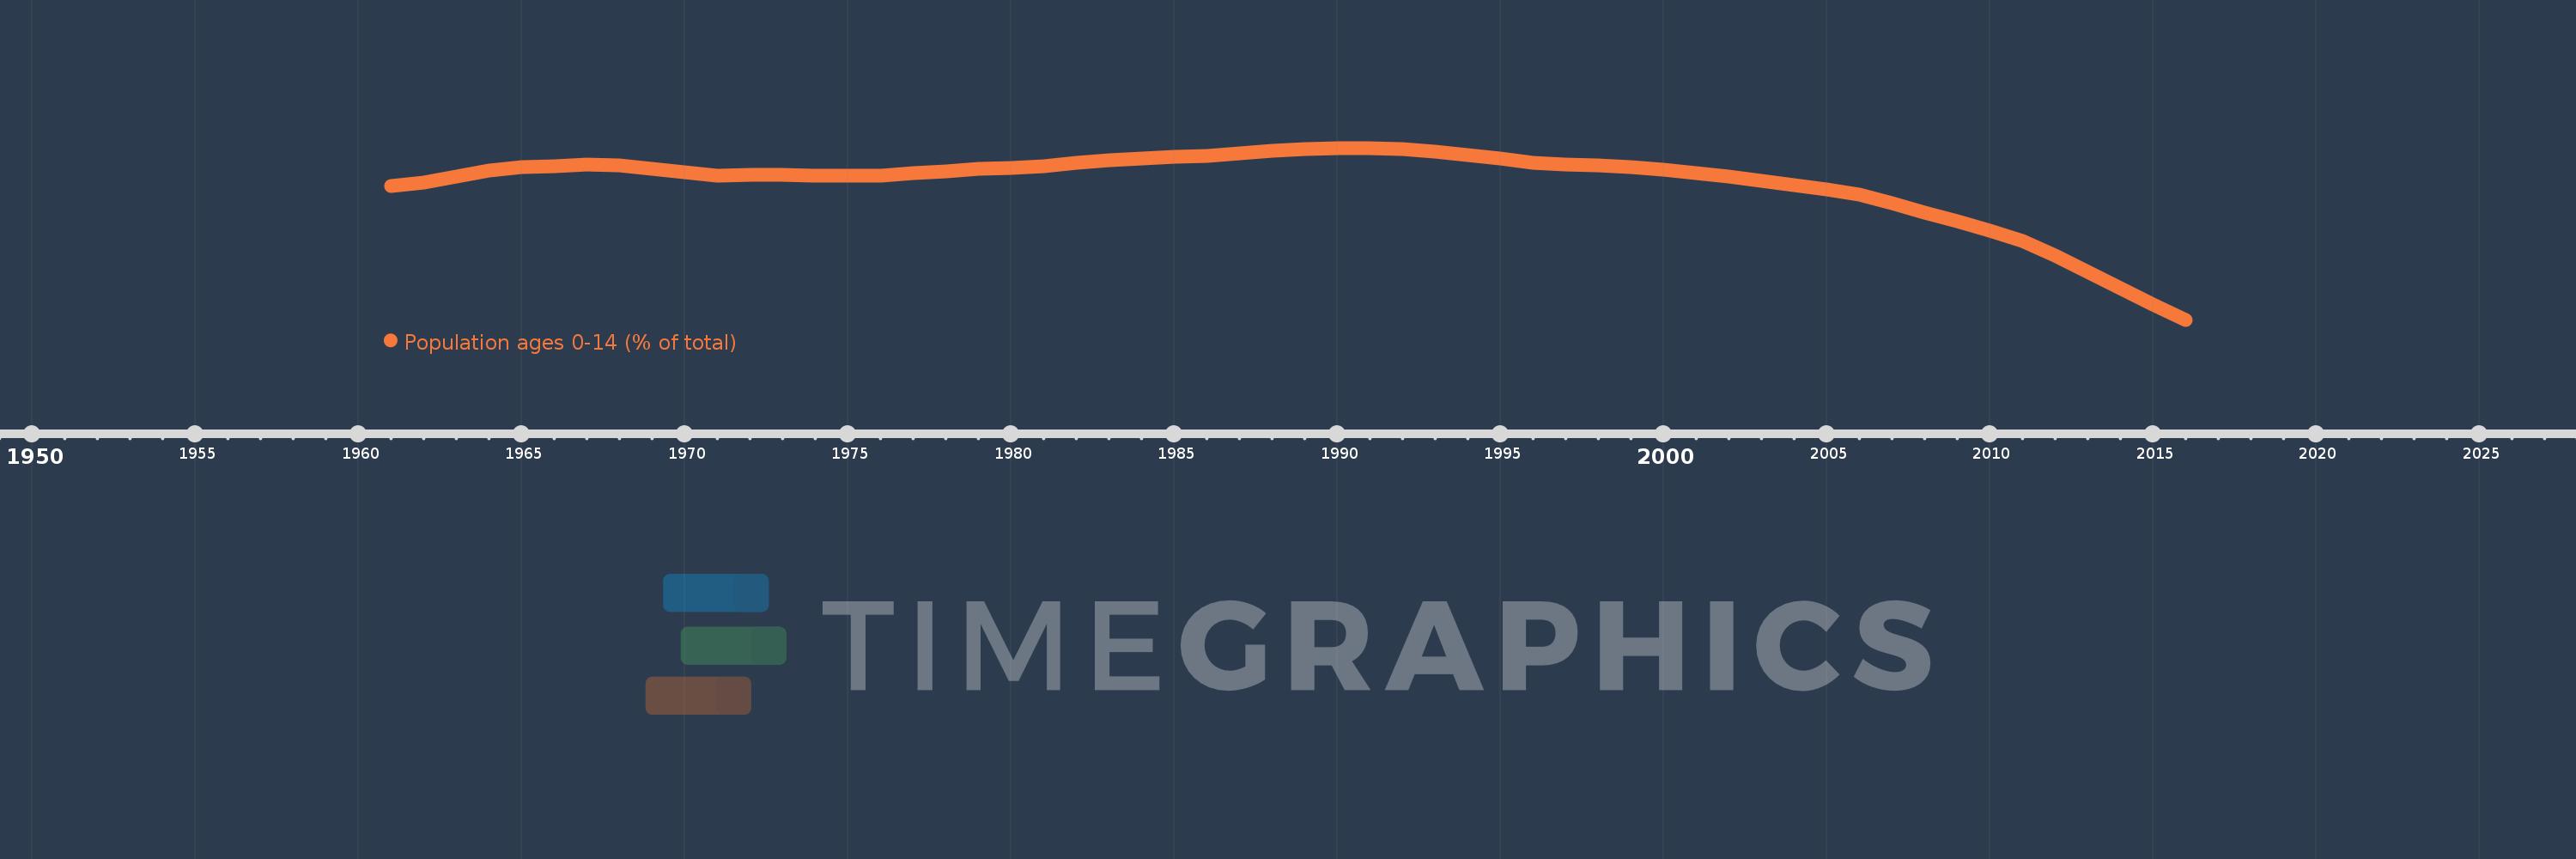
Population ages 0-14 (% of total)
2016,2015,2014,2013,2012,2011,2010,2009,2008,2007,2006,2005,2004,2003,2002,2001,2000,1999,1998,1997,1996,1995,1994,1993,1992,1991,1990,1989,1988,1987,1986,1985,1984,1983,1982,1981,1980,1979,1978,1977,1976,1975,1974,1973,1972,1971,1970,1969,1968,1967,1966,1965,1964,1963,1962,1961
Estas estatísticas em outros países:
AfghanistanAlbaniaAlgeriaAngolaAntigua and BarbudaArab WorldArgentinaArmeniaArubaAustraliaAustriaAzerbaijanBahamas, TheBahrainBangladeshBarbadosBelarusBelgiumBelizeBeninBhutanBoliviaBosnia and HerzegovinaBotswanaBrazilBrunei DarussalamBulgariaBurkina FasoBurundiCabo VerdeCambodiaCameroonCanadaCaribbean small statesCentral African RepublicCentral Europe and the BalticsChadChannel IslandsChileChinaColombiaComorosCongo, Dem. Rep.Congo, Rep.Costa RicaCote d'IvoireCroatiaCubaCuracaoCyprusCzech RepublicDenmarkDjiboutiDominican RepublicEarly-demographic dividendEast Asia & PacificEast Asia & Pacific (excluding high income)East Asia & Pacific (IDA & IBRD countries)EcuadorEgypt, Arab Rep.El SalvadorEquatorial GuineaEritreaEstoniaEthiopiaEuro areaEurope & Central AsiaEurope & Central Asia (excluding high income)Europe & Central Asia (IDA & IBRD countries)European UnionFijiFinlandFragile and conflict affected situationsFranceFrench PolynesiaGabonGambia, TheGeorgiaGermanyGhanaGreeceGrenadaGuamGuatemalaGuineaGuinea-BissauGuyanaHaitiHeavily indebted poor countries (HIPC)High incomeHondurasHong Kong SAR, ChinaHungaryIBRD onlyIcelandIDA & IBRD totalIDA blendIDA onlyIDA totalIndiaIndonesiaIran, Islamic Rep.IraqIrelandIsraelItalyJamaicaJapanJordanKazakhstanKenyaKiribatiKorea, Dem. People’s Rep.Korea, Rep.KosovoKuwaitKyrgyz RepublicLao PDRLate-demographic dividendLatin America & Caribbean Latin America & Caribbean (excluding high income)Latin America & the Caribbean (IDA & IBRD countries)LatviaLeast developed countries: UN classificationLebanonLesothoLiberiaLibyaLithuaniaLow & middle incomeLow incomeLower middle incomeLuxembourgMacao SAR, ChinaMacedonia, FYRMadagascarMalawiMalaysiaMaldivesMaliMaltaMauritaniaMauritiusMexicoMicronesia, Fed. Sts.Middle East & North AfricaMiddle East & North Africa (excluding high income)Middle East & North Africa (IDA & IBRD countries)Middle incomeMoldovaMongoliaMontenegroMoroccoMozambiqueMyanmarNamibiaNepalNetherlandsNew CaledoniaNew ZealandNicaraguaNigerNigeriaNorth AmericaNorwayOECD membersOmanOther small statesPacific island small statesPakistanPanamaPapua New GuineaParaguayPeruPhilippinesPolandPortugalPost-demographic dividendPre-demographic dividendPuerto RicoQatarRomaniaRussian FederationRwandaSamoaSao Tome and PrincipeSaudi ArabiaSenegalSerbiaSeychellesSierra LeoneSingaporeSlovak RepublicSloveniaSmall statesSolomon IslandsSomaliaSouth AfricaSouth AsiaSouth Asia (IDA & IBRD)South SudanSpainSri LankaSt. LuciaSt. Vincent and the GrenadinesSub-Saharan Africa Sub-Saharan Africa (excluding high income)Sub-Saharan Africa (IDA & IBRD countries)SudanSurinameSwazilandSwedenSwitzerlandSyrian Arab RepublicTajikistanTanzaniaThailandTimor-LesteTogoTongaTrinidad and TobagoTunisiaTurkeyTurkmenistanUgandaUkraineUnited Arab EmiratesUnited KingdomUnited StatesUpper middle incomeUruguayUzbekistanVanuatuVenezuela, RBVietnamVirgin Islands (U.S.)West Bank and GazaWorldYemen, Rep.ZambiaZimbabwe Linha do tempo:
Nesta escala de tempo está apresentado um gráfico de 1961 ano até 2016 ano Nepal. Dados de 1960 ano ausente. O número de observações reais por data: 56.
Fonte (nome):
Indicadores de desenvolvimento mundial
Fonte (organização):
World Bank staff estimates based on age distributions of United Nations Population Division's World Population Prospects.
Categorias:
Education, Health
Foi atualizado:
23 abr 2017 ano
Indicadores de alterações dos valores ao longo dos anos
Mínimo:
32.664
1 jan 2016 ano
Máximo:
42.468
1 jan 1991 ano
Na data de observação
Valor
Mudança absoluta
A alteração em relação ao valor anterior
1 jan 1961 ano
40.276
+40.276
0.0%
1 jan 1962 ano
40.488
+0.212
0.53%
1 jan 1963 ano
40.815
+0.327
0.81%
1 jan 1964 ano
41.164
+0.349
0.85%
1 jan 1965 ano
41.382
+0.218
0.53%
1 jan 1966 ano
41.407
+0.025
0.06%
1 jan 1967 ano
41.523
+0.117
0.28%
1 jan 1968 ano
41.456
-0.067
-0.16%
1 jan 1969 ano
41.27
-0.186
-0.45%
1 jan 1970 ano
41.067
-0.204
-0.49%
1 jan 1971 ano
40.895
-0.171
-0.42%
1 jan 1972 ano
40.923
+0.027
0.07%
1 jan 1973 ano
40.919
-0.003
-0.01%
1 jan 1974 ano
40.906
-0.014
-0.03%
1 jan 1975 ano
40.889
-0.016
-0.04%
1 jan 1976 ano
40.872
-0.018
-0.04%
1 jan 1977 ano
41.024
+0.152
0.37%
1 jan 1978 ano
41.154
+0.13
0.32%
1 jan 1979 ano
41.265
+0.11
0.27%
1 jan 1980 ano
41.35
+0.085
0.21%
1 jan 1981 ano
41.406
+0.056
0.14%
1 jan 1982 ano
41.619
+0.213
0.52%
1 jan 1983 ano
41.77
+0.151
0.36%
1 jan 1984 ano
41.875
+0.105
0.25%
1 jan 1985 ano
41.95
+0.075
0.18%
1 jan 1986 ano
42.001
+0.051
0.12%
1 jan 1987 ano
42.18
+0.179
0.43%
1 jan 1988 ano
42.312
+0.132
0.31%
1 jan 1989 ano
42.403
+0.091
0.21%
1 jan 1990 ano
42.455
+0.052
0.12%
1 jan 1991 ano
42.468
+0.014
0.03%
1 jan 1992 ano
42.401
-0.068
-0.16%
1 jan 1993 ano
42.269
-0.132
-0.31%
1 jan 1994 ano
42.085
-0.184
-0.44%
1 jan 1995 ano
41.862
-0.223
-0.53%
1 jan 1996 ano
41.611
-0.251
-0.6%
1 jan 1997 ano
41.54
-0.071
-0.17%
1 jan 1998 ano
41.455
-0.084
-0.2%
1 jan 1999 ano
41.353
-0.103
-0.25%
1 jan 2000 ano
41.214
-0.138
-0.33%
1 jan 2001 ano
41.023
-0.191
-0.46%
1 jan 2002 ano
40.817
-0.206
-0.5%
1 jan 2003 ano
40.6
-0.217
-0.53%
1 jan 2004 ano
40.365
-0.235
-0.58%
1 jan 2005 ano
40.111
-0.254
-0.63%
1 jan 2006 ano
39.827
-0.284
-0.71%
1 jan 2007 ano
39.293
-0.534
-1.34%
1 jan 2008 ano
38.781
-0.512
-1.3%
1 jan 2009 ano
38.281
-0.501
-1.29%
1 jan 2010 ano
37.755
-0.526
-1.37%
1 jan 2011 ano
37.172
-0.583
-1.54%
1 jan 2012 ano
36.323
-0.849
-2.29%
1 jan 2013 ano
35.399
-0.924
-2.54%
1 jan 2014 ano
34.44
-0.958
-2.71%
1 jan 2015 ano
33.516
-0.924
-2.68%
1 jan 2016 ano
32.664
-0.852
-2.54%
Classificação de países por estatísticas atuais por anos


Comentários: