29
/pt/
pt
AIzaSyAYiBZKx7MnpbEhh9jyipgxe19OcubqV5w
April 1, 2024
59112
Sub-Saharan Africa
SSF
false
2
1
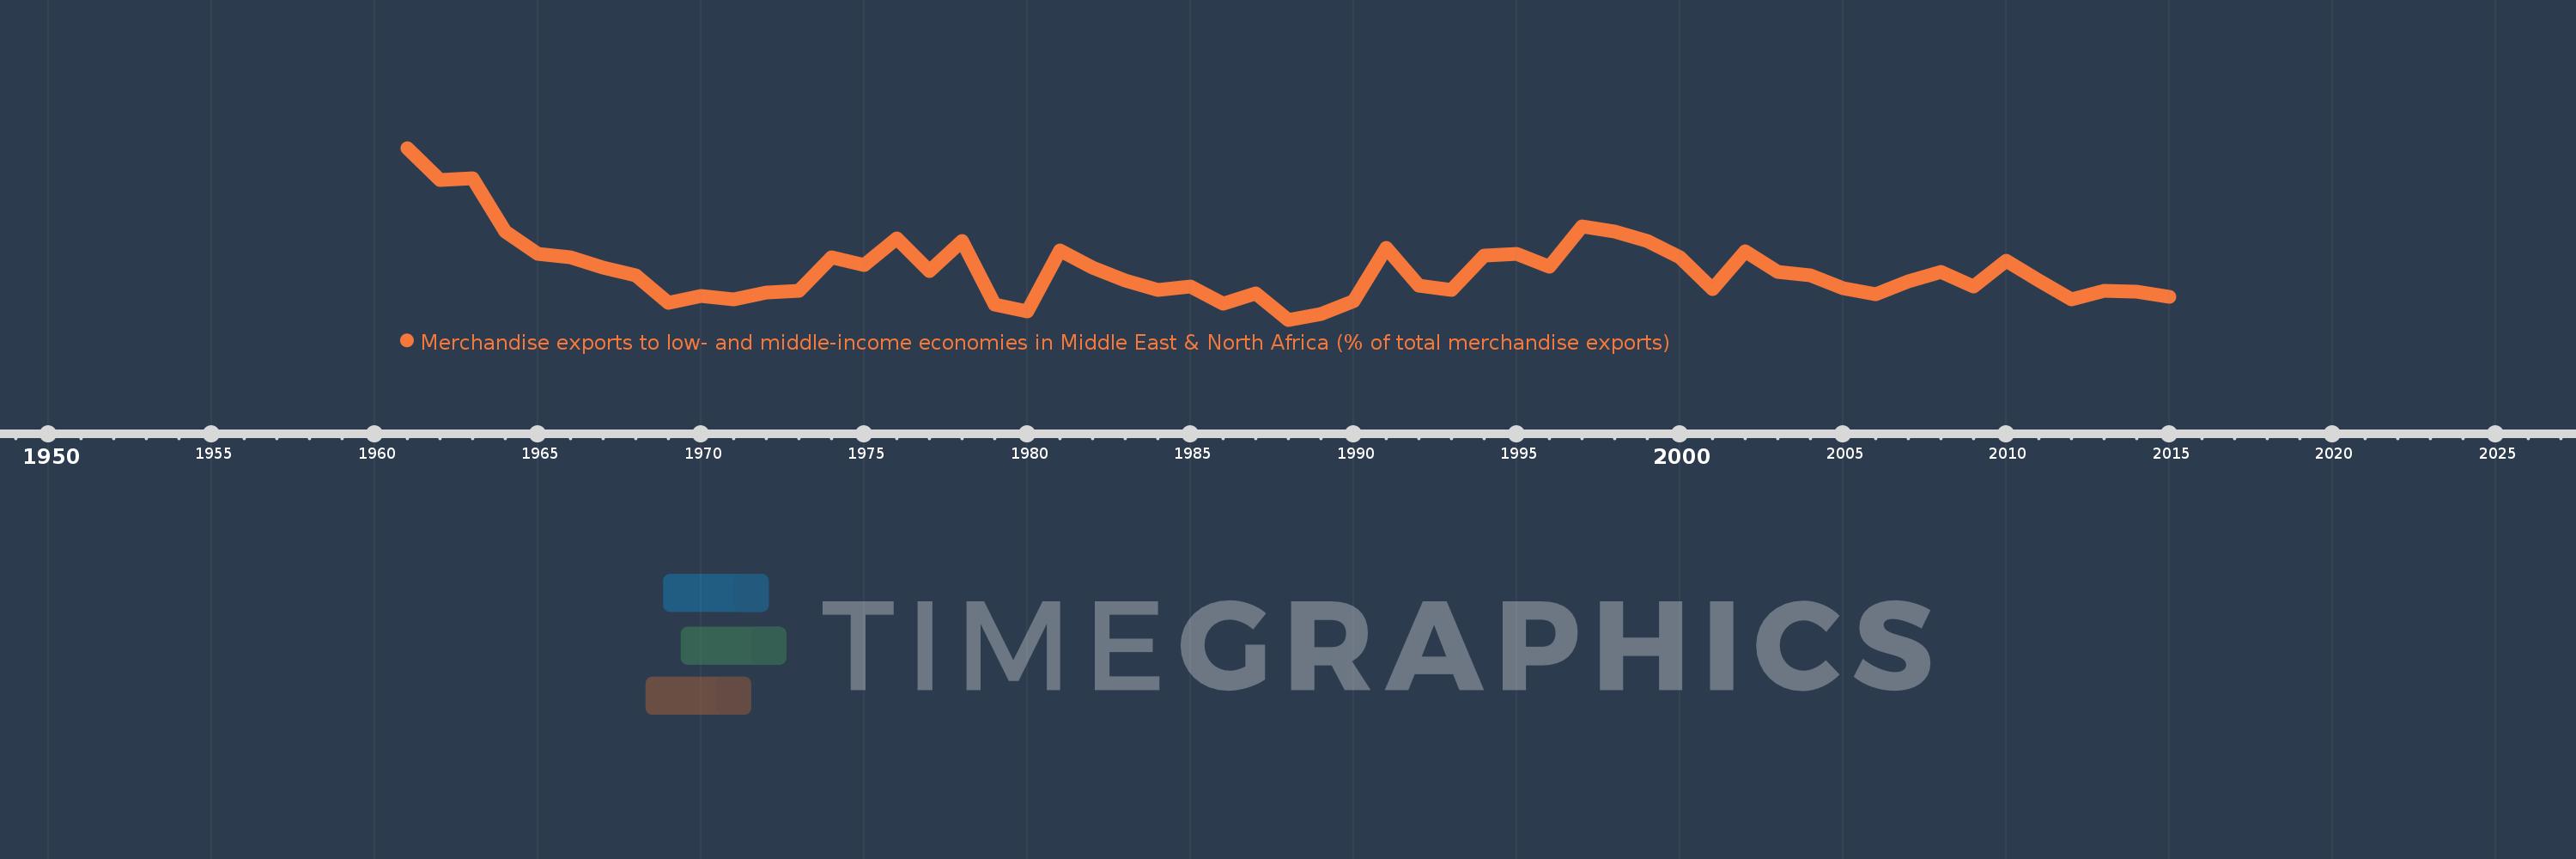
Merchandise exports to low- and middle-income economies in Middle East & North Africa (% of total merchandise exports)
2015,2014,2013,2012,2011,2010,2009,2008,2007,2006,2005,2004,2003,2002,2001,2000,1999,1998,1997,1996,1995,1994,1993,1992,1991,1990,1989,1988,1987,1986,1985,1984,1983,1982,1981,1980,1979,1978,1977,1976,1975,1974,1973,1972,1971,1970,1969,1968,1967,1966,1965,1964,1963,1962,1961
Estas estatísticas em outros países:
AfghanistanAlbaniaAlgeriaAngolaArab WorldArgentinaArmeniaArubaAustraliaAustriaAzerbaijanBahamas, TheBahrainBangladeshBarbadosBelarusBelgiumBelizeBeninBermudaBoliviaBosnia and HerzegovinaBrazilBrunei DarussalamBulgariaBurkina FasoBurundiCabo VerdeCambodiaCameroonCanadaCaribbean small statesCentral African RepublicCentral Europe and the BalticsChadChileChinaColombiaComorosCongo, Dem. Rep.Congo, Rep.Costa RicaCote d'IvoireCroatiaCubaCyprusCzech RepublicDenmarkDjiboutiDominicaDominican RepublicEarly-demographic dividendEast Asia & PacificEast Asia & Pacific (excluding high income)East Asia & Pacific (IDA & IBRD countries)EcuadorEgypt, Arab Rep.El SalvadorEquatorial GuineaEstoniaEthiopiaEuro areaEurope & Central AsiaEurope & Central Asia (excluding high income)Europe & Central Asia (IDA & IBRD countries)European UnionFijiFinlandFragile and conflict affected situationsFranceGabonGambia, TheGeorgiaGermanyGhanaGreeceGreenlandGrenadaGuatemalaGuineaGuinea-BissauGuyanaHaitiHeavily indebted poor countries (HIPC)High incomeHondurasHong Kong SAR, ChinaHungaryIBRD onlyIcelandIDA & IBRD totalIDA blendIDA onlyIDA totalIndiaIndonesiaIran, Islamic Rep.IraqIrelandIsraelItalyJamaicaJapanJordanKazakhstanKenyaKorea, Dem. People’s Rep.Korea, Rep.KosovoKuwaitKyrgyz RepublicLao PDRLate-demographic dividendLatin America & Caribbean Latin America & Caribbean (excluding high income)Latin America & the Caribbean (IDA & IBRD countries)LatviaLeast developed countries: UN classificationLebanonLiberiaLibyaLithuaniaLow & middle incomeLow incomeLower middle incomeLuxembourgMacao SAR, ChinaMacedonia, FYRMadagascarMalawiMalaysiaMaliMaltaMauritaniaMauritiusMexicoMiddle East & North AfricaMiddle East & North Africa (excluding high income)Middle East & North Africa (IDA & IBRD countries)Middle incomeMoldovaMongoliaMontenegroMoroccoMozambiqueMyanmarNepalNetherlandsNew CaledoniaNew ZealandNicaraguaNigerNigeriaNorth AmericaNorwayOECD membersOmanOther small statesPacific island small statesPakistanPanamaPapua New GuineaParaguayPeruPhilippinesPolandPortugalPost-demographic dividendPre-demographic dividendQatarRomaniaRussian FederationRwandaSamoaSaudi ArabiaSenegalSerbiaSeychellesSierra LeoneSingaporeSlovak RepublicSloveniaSmall statesSomaliaSouth AfricaSouth AsiaSouth Asia (IDA & IBRD)SpainSri LankaSt. LuciaSub-Saharan Africa Sub-Saharan Africa (excluding high income)Sub-Saharan Africa (IDA & IBRD countries)SudanSurinameSwedenSwitzerlandSyrian Arab RepublicTajikistanTanzaniaThailandTogoTrinidad and TobagoTunisiaTurkeyTurkmenistanUgandaUkraineUnited Arab EmiratesUnited KingdomUnited StatesUpper middle incomeUruguayUzbekistanVenezuela, RBVietnamWorldYemen, Rep.ZambiaZimbabwe Linha do tempo:
Nesta escala de tempo está apresentado um gráfico de 1961 ano até 2015 ano Sub-Saharan Africa . Dados de 1960 ano ausente. O número de observações reais por data: 55.
Fonte (nome):
Indicadores de desenvolvimento mundial
Fonte (organização):
World Bank staff estimates based data from International Monetary Fund's Direction of Trade database.
Categorias:
Private Sector, Trade
Foi atualizado:
23 abr 2017 ano
Indicadores de alterações dos valores ao longo dos anos
Mínimo:
0.505
1 jan 1988 ano
Máximo:
1.806
1 jan 1961 ano
Na data de observação
Valor
Mudança absoluta
A alteração em relação ao valor anterior
1 jan 1961 ano
1.806
+1.806
0.0%
1 jan 1962 ano
1.561
-0.245
-13.57%
1 jan 1963 ano
1.579
+0.018
1.16%
1 jan 1964 ano
1.171
-0.408
-25.85%
1 jan 1965 ano
1.001
-0.17
-14.49%
1 jan 1966 ano
0.98
-0.021
-2.14%
1 jan 1967 ano
0.902
-0.078
-7.92%
1 jan 1968 ano
0.839
-0.063
-7.01%
1 jan 1969 ano
0.634
-0.205
-24.41%
1 jan 1970 ano
0.683
+0.049
7.79%
1 jan 1971 ano
0.662
-0.022
-3.16%
1 jan 1972 ano
0.71
+0.048
7.24%
1 jan 1973 ano
0.721
+0.012
1.66%
1 jan 1974 ano
0.981
+0.26
35.98%
1 jan 1975 ano
0.917
-0.064
-6.56%
1 jan 1976 ano
1.119
+0.203
22.11%
1 jan 1977 ano
0.874
-0.246
-21.96%
1 jan 1978 ano
1.103
+0.229
26.23%
1 jan 1979 ano
0.62
-0.483
-43.78%
1 jan 1980 ano
0.568
-0.052
-8.36%
1 jan 1981 ano
1.027
+0.459
80.71%
1 jan 1982 ano
0.9
-0.127
-12.32%
1 jan 1983 ano
0.803
-0.097
-10.74%
1 jan 1984 ano
0.731
-0.073
-9.05%
1 jan 1985 ano
0.758
+0.027
3.75%
1 jan 1986 ano
0.627
-0.131
-17.26%
1 jan 1987 ano
0.703
+0.076
12.14%
1 jan 1988 ano
0.505
-0.198
-28.21%
1 jan 1989 ano
0.55
+0.045
8.95%
1 jan 1990 ano
0.643
+0.093
16.96%
1 jan 1991 ano
1.051
+0.408
63.33%
1 jan 1992 ano
0.76
-0.291
-27.73%
1 jan 1993 ano
0.729
-0.031
-4.02%
1 jan 1994 ano
0.994
+0.265
36.36%
1 jan 1995 ano
1.001
+0.007
0.69%
1 jan 1996 ano
0.906
-0.095
-9.47%
1 jan 1997 ano
1.211
+0.305
33.62%
1 jan 1998 ano
1.17
-0.041
-3.4%
1 jan 1999 ano
1.103
-0.067
-5.69%
1 jan 2000 ano
0.975
-0.128
-11.63%
1 jan 2001 ano
0.734
-0.241
-24.73%
1 jan 2002 ano
1.021
+0.287
39.1%
1 jan 2003 ano
0.866
-0.155
-15.17%
1 jan 2004 ano
0.843
-0.023
-2.63%
1 jan 2005 ano
0.741
-0.102
-12.09%
1 jan 2006 ano
0.697
-0.044
-5.89%
1 jan 2007 ano
0.797
+0.099
14.22%
1 jan 2008 ano
0.867
+0.07
8.83%
1 jan 2009 ano
0.755
-0.112
-12.93%
1 jan 2010 ano
0.951
+0.196
26.03%
1 jan 2011 ano
0.802
-0.149
-15.69%
1 jan 2012 ano
0.658
-0.144
-18.01%
1 jan 2013 ano
0.724
+0.067
10.16%
1 jan 2014 ano
0.717
-0.007
-1.0%
1 jan 2015 ano
0.679
-0.038
-5.33%
Classificação de países por estatísticas atuais por anos


Comentários: