29
/pt/
pt
AIzaSyAYiBZKx7MnpbEhh9jyipgxe19OcubqV5w
April 1, 2024
228769
Romania
ROU
true
2
1
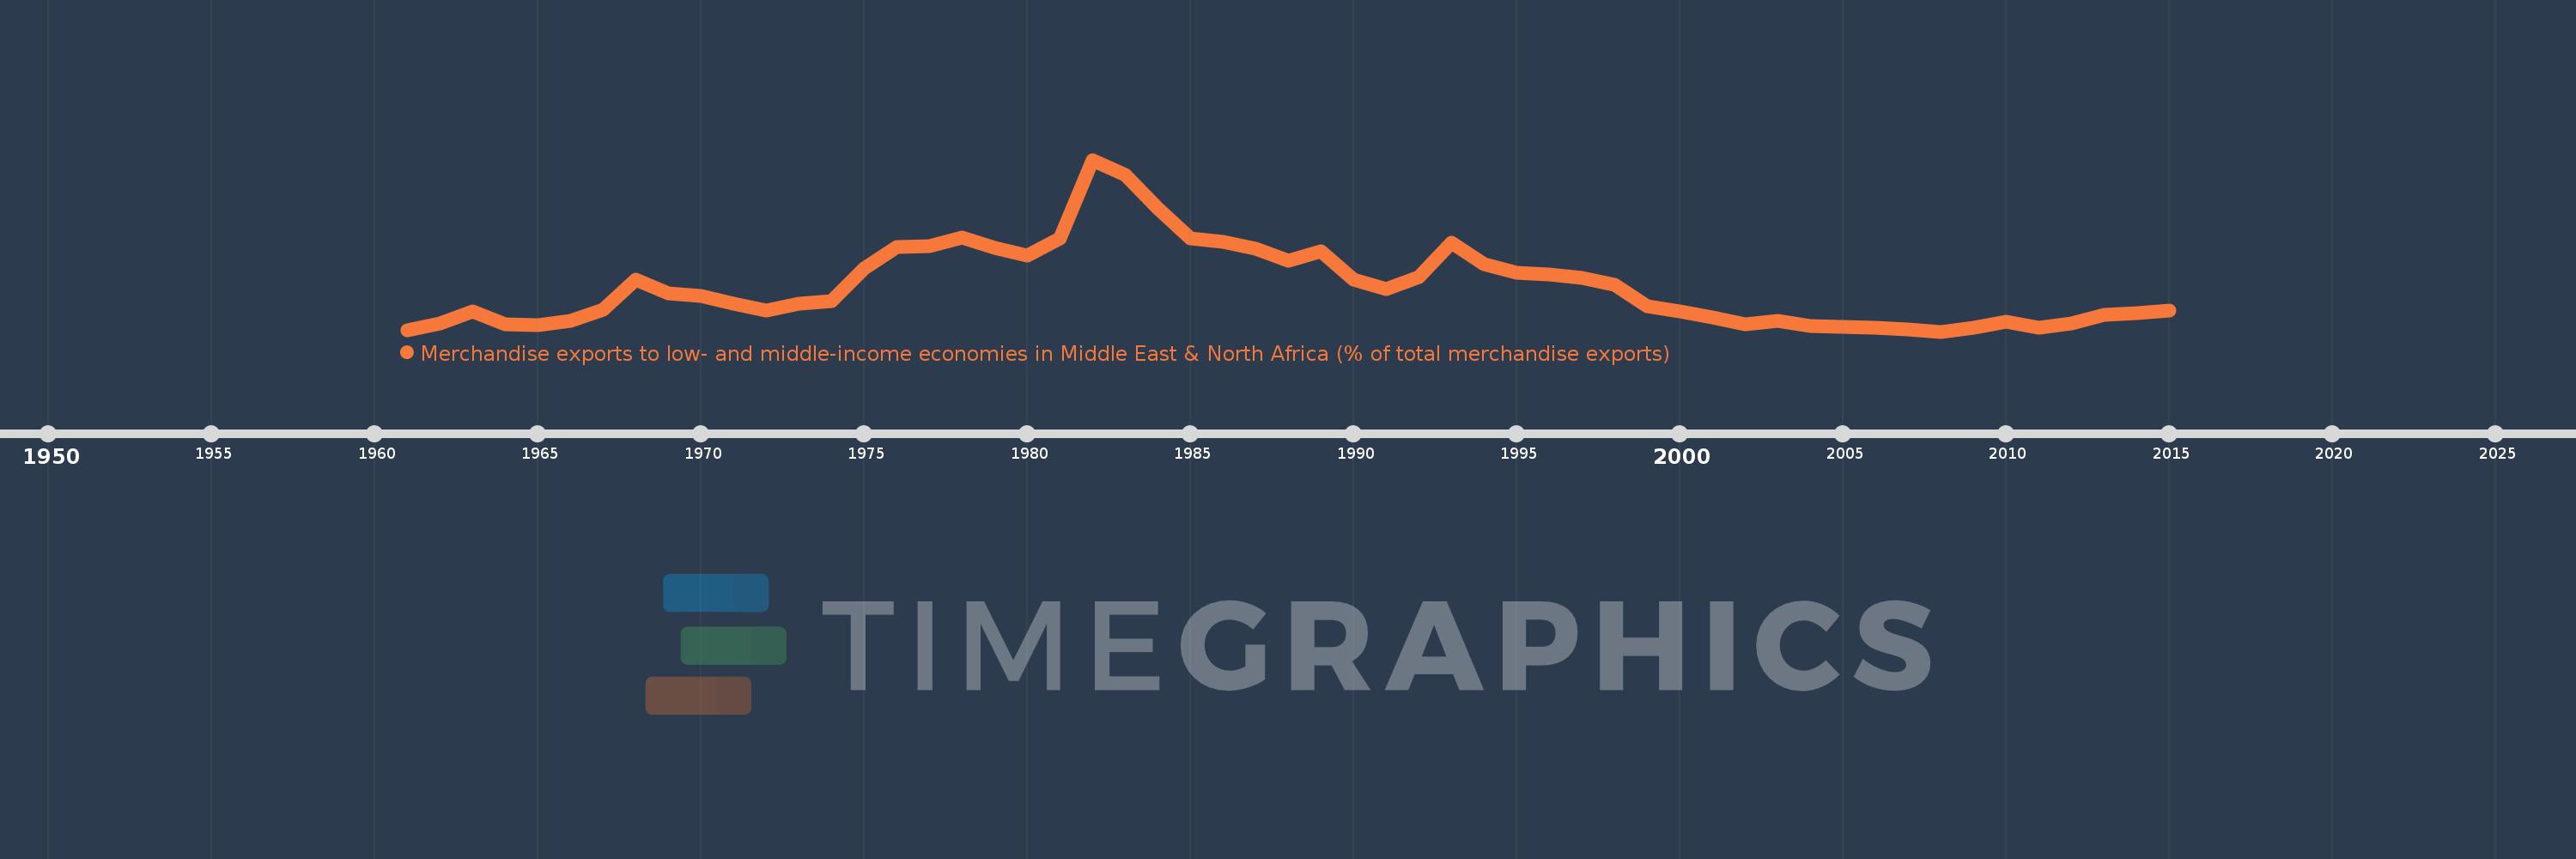
Merchandise exports to low- and middle-income economies in Middle East & North Africa (% of total merchandise exports)
2015,2014,2013,2012,2011,2010,2009,2008,2007,2006,2005,2004,2003,2002,2001,2000,1999,1998,1997,1996,1995,1994,1993,1992,1991,1990,1989,1988,1987,1986,1985,1984,1983,1982,1981,1980,1979,1978,1977,1976,1975,1974,1973,1972,1971,1970,1969,1968,1967,1966,1965,1964,1963,1962,1961
Estas estatísticas em outros países:
AfghanistanAlbaniaAlgeriaAngolaArab WorldArgentinaArmeniaArubaAustraliaAustriaAzerbaijanBahamas, TheBahrainBangladeshBarbadosBelarusBelgiumBelizeBeninBermudaBoliviaBosnia and HerzegovinaBrazilBrunei DarussalamBulgariaBurkina FasoBurundiCabo VerdeCambodiaCameroonCanadaCaribbean small statesCentral African RepublicCentral Europe and the BalticsChadChileChinaColombiaComorosCongo, Dem. Rep.Congo, Rep.Costa RicaCote d'IvoireCroatiaCubaCyprusCzech RepublicDenmarkDjiboutiDominicaDominican RepublicEarly-demographic dividendEast Asia & PacificEast Asia & Pacific (excluding high income)East Asia & Pacific (IDA & IBRD countries)EcuadorEgypt, Arab Rep.El SalvadorEquatorial GuineaEstoniaEthiopiaEuro areaEurope & Central AsiaEurope & Central Asia (excluding high income)Europe & Central Asia (IDA & IBRD countries)European UnionFijiFinlandFragile and conflict affected situationsFranceGabonGambia, TheGeorgiaGermanyGhanaGreeceGreenlandGrenadaGuatemalaGuineaGuinea-BissauGuyanaHaitiHeavily indebted poor countries (HIPC)High incomeHondurasHong Kong SAR, ChinaHungaryIBRD onlyIcelandIDA & IBRD totalIDA blendIDA onlyIDA totalIndiaIndonesiaIran, Islamic Rep.IraqIrelandIsraelItalyJamaicaJapanJordanKazakhstanKenyaKorea, Dem. People’s Rep.Korea, Rep.KosovoKuwaitKyrgyz RepublicLao PDRLate-demographic dividendLatin America & Caribbean Latin America & Caribbean (excluding high income)Latin America & the Caribbean (IDA & IBRD countries)LatviaLeast developed countries: UN classificationLebanonLiberiaLibyaLithuaniaLow & middle incomeLow incomeLower middle incomeLuxembourgMacao SAR, ChinaMacedonia, FYRMadagascarMalawiMalaysiaMaliMaltaMauritaniaMauritiusMexicoMiddle East & North AfricaMiddle East & North Africa (excluding high income)Middle East & North Africa (IDA & IBRD countries)Middle incomeMoldovaMongoliaMontenegroMoroccoMozambiqueMyanmarNepalNetherlandsNew CaledoniaNew ZealandNicaraguaNigerNigeriaNorth AmericaNorwayOECD membersOmanOther small statesPacific island small statesPakistanPanamaPapua New GuineaParaguayPeruPhilippinesPolandPortugalPost-demographic dividendPre-demographic dividendQatarRomaniaRussian FederationRwandaSamoaSaudi ArabiaSenegalSerbiaSeychellesSierra LeoneSingaporeSlovak RepublicSloveniaSmall statesSomaliaSouth AfricaSouth AsiaSouth Asia (IDA & IBRD)SpainSri LankaSt. LuciaSub-Saharan Africa Sub-Saharan Africa (excluding high income)Sub-Saharan Africa (IDA & IBRD countries)SudanSurinameSwedenSwitzerlandSyrian Arab RepublicTajikistanTanzaniaThailandTogoTrinidad and TobagoTunisiaTurkeyTurkmenistanUgandaUkraineUnited Arab EmiratesUnited KingdomUnited StatesUpper middle incomeUruguayUzbekistanVenezuela, RBVietnamWorldYemen, Rep.ZambiaZimbabwe Linha do tempo:
Nesta escala de tempo está apresentado um gráfico de 1961 ano até 2015 ano Romania. Dados de 1960 ano ausente. O número de observações reais por data: 55.
Fonte (nome):
Indicadores de desenvolvimento mundial
Fonte (organização):
World Bank staff estimates based data from International Monetary Fund's Direction of Trade database.
Categorias:
Private Sector, Trade
Foi atualizado:
23 abr 2017 ano
Indicadores de alterações dos valores ao longo dos anos
Mínimo:
2.497
1 jan 2008 ano
Máximo:
21.523
1 jan 1982 ano
Na data de observação
Valor
Mudança absoluta
A alteração em relação ao valor anterior
1 jan 1961 ano
2.687
+2.687
0.0%
1 jan 1962 ano
3.374
+0.687
25.58%
1 jan 1963 ano
4.779
+1.404
41.61%
1 jan 1964 ano
3.265
-1.513
-31.67%
1 jan 1965 ano
3.242
-0.024
-0.72%
1 jan 1966 ano
3.693
+0.452
13.93%
1 jan 1967 ano
4.899
+1.205
32.64%
1 jan 1968 ano
8.248
+3.349
68.37%
1 jan 1969 ano
6.753
-1.495
-18.12%
1 jan 1970 ano
6.449
-0.304
-4.51%
1 jan 1971 ano
5.595
-0.854
-13.25%
1 jan 1972 ano
4.796
-0.799
-14.28%
1 jan 1973 ano
5.6
+0.805
16.78%
1 jan 1974 ano
5.846
+0.245
4.38%
1 jan 1975 ano
9.465
+3.619
61.91%
1 jan 1976 ano
11.848
+2.383
25.18%
1 jan 1977 ano
11.937
+0.089
0.75%
1 jan 1978 ano
12.944
+1.006
8.43%
1 jan 1979 ano
11.777
-1.167
-9.02%
1 jan 1980 ano
10.95
-0.826
-7.02%
1 jan 1981 ano
12.863
+1.912
17.46%
1 jan 1982 ano
21.523
+8.66
67.33%
1 jan 1983 ano
19.828
-1.695
-7.88%
1 jan 1984 ano
16.161
-3.667
-18.49%
1 jan 1985 ano
12.798
-3.363
-20.81%
1 jan 1986 ano
12.392
-0.405
-3.17%
1 jan 1987 ano
11.684
-0.708
-5.71%
1 jan 1988 ano
10.316
-1.368
-11.71%
1 jan 1989 ano
11.392
+1.076
10.43%
1 jan 1990 ano
8.244
-3.147
-27.63%
1 jan 1991 ano
7.162
-1.082
-13.12%
1 jan 1992 ano
8.491
+1.329
18.55%
1 jan 1993 ano
12.354
+3.863
45.5%
1 jan 1994 ano
9.955
-2.4
-19.42%
1 jan 1995 ano
9.033
-0.922
-9.26%
1 jan 1996 ano
8.777
-0.256
-2.84%
1 jan 1997 ano
8.417
-0.36
-4.1%
1 jan 1998 ano
7.665
-0.752
-8.93%
1 jan 1999 ano
5.276
-2.389
-31.16%
1 jan 2000 ano
4.755
-0.521
-9.88%
1 jan 2001 ano
4.023
-0.732
-15.39%
1 jan 2002 ano
3.29
-0.733
-18.22%
1 jan 2003 ano
3.647
+0.358
10.87%
1 jan 2004 ano
3.111
-0.536
-14.7%
1 jan 2005 ano
3.01
-0.102
-3.27%
1 jan 2006 ano
2.929
-0.081
-2.69%
1 jan 2007 ano
2.727
-0.201
-6.88%
1 jan 2008 ano
2.497
-0.23
-8.44%
1 jan 2009 ano
2.947
+0.45
18.03%
1 jan 2010 ano
3.56
+0.613
20.79%
1 jan 2011 ano
2.944
-0.615
-17.29%
1 jan 2012 ano
3.419
+0.475
16.12%
1 jan 2013 ano
4.306
+0.887
25.95%
1 jan 2014 ano
4.567
+0.261
6.06%
1 jan 2015 ano
4.802
+0.235
5.15%
Classificação de países por estatísticas atuais por anos


Comentários: