29
/pt/
pt
AIzaSyAYiBZKx7MnpbEhh9jyipgxe19OcubqV5w
April 1, 2024
171945
Kuwait
KWT
true
2
1
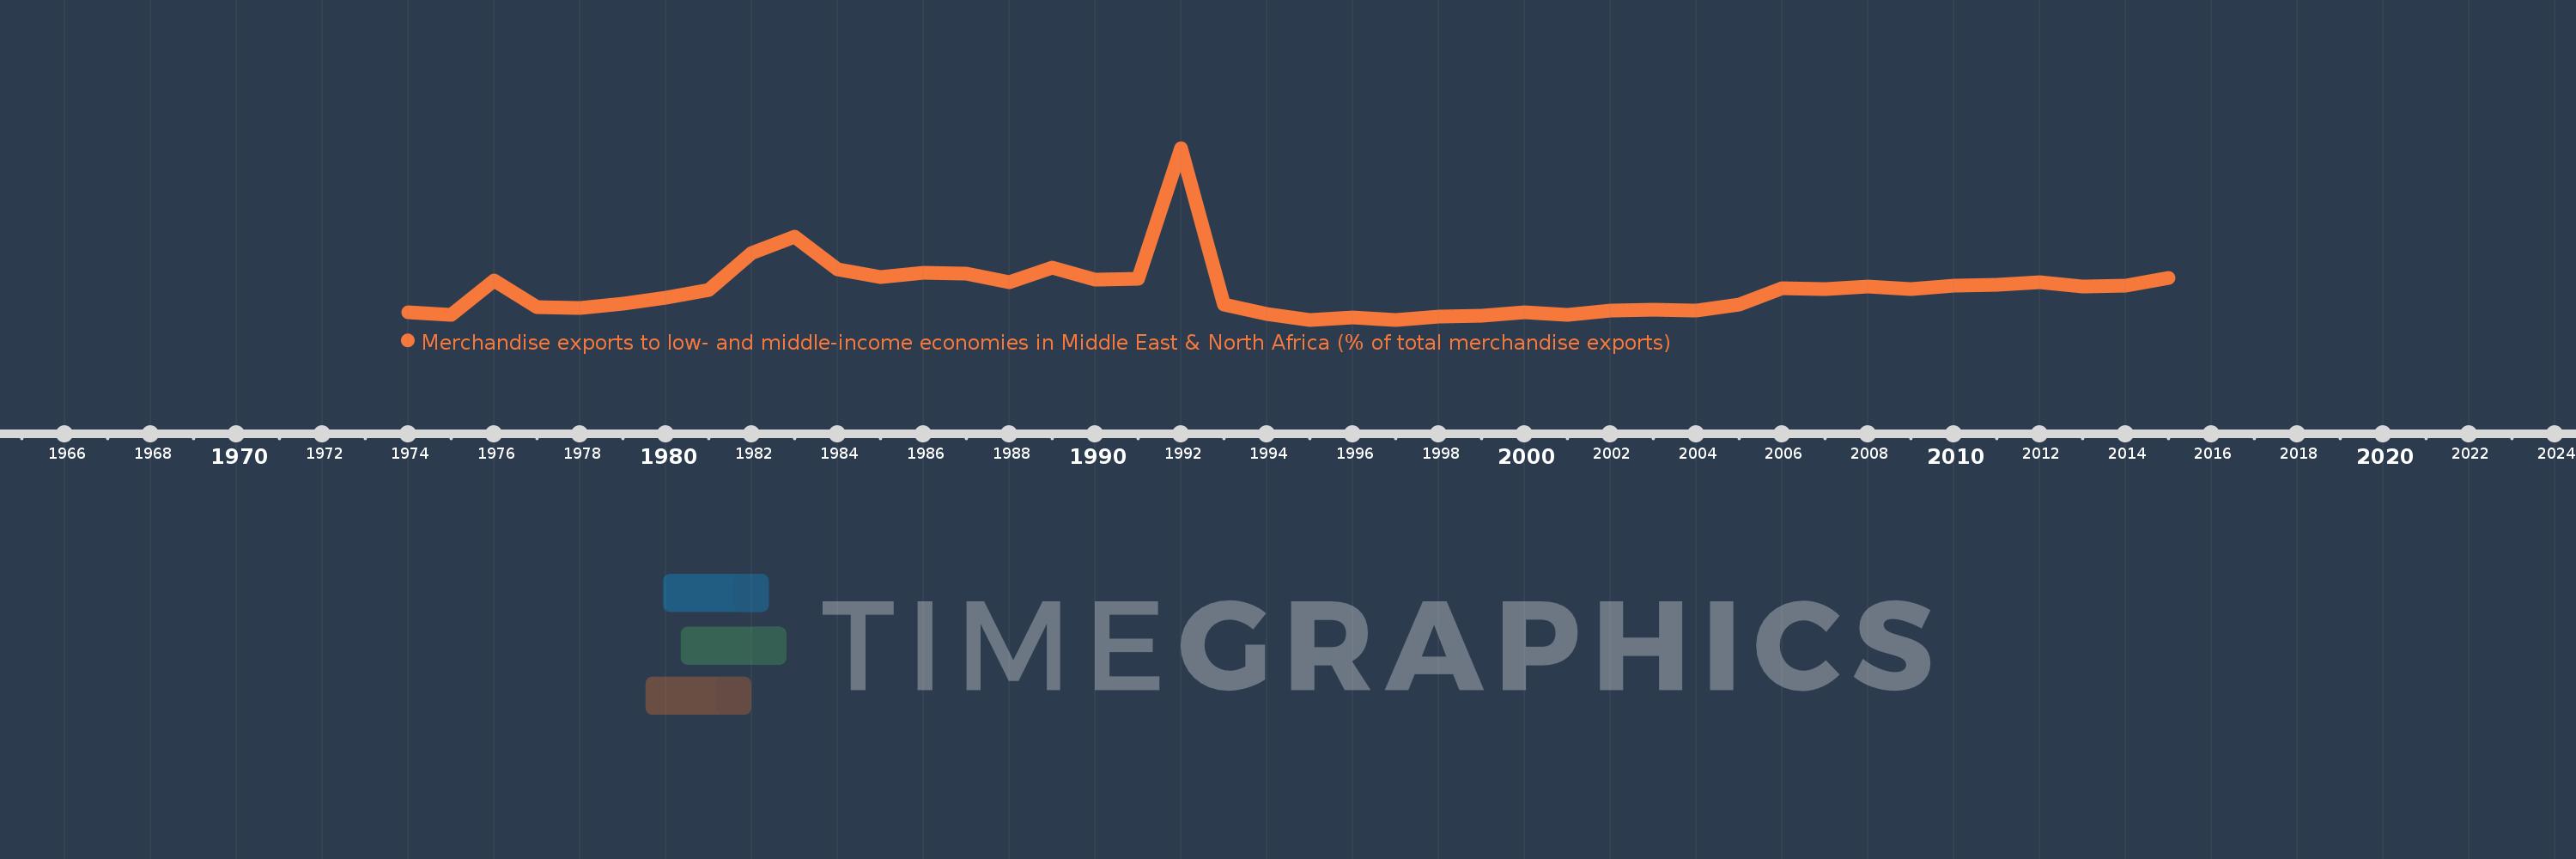
Merchandise exports to low- and middle-income economies in Middle East & North Africa (% of total merchandise exports)
2015,2014,2013,2012,2011,2010,2009,2008,2007,2006,2005,2004,2003,2002,2001,2000,1999,1998,1997,1996,1995,1994,1993,1992,1991,1990,1989,1988,1987,1986,1985,1984,1983,1982,1981,1980,1979,1978,1977,1976,1975,1974
Estas estatísticas em outros países:
AfghanistanAlbaniaAlgeriaAngolaArab WorldArgentinaArmeniaArubaAustraliaAustriaAzerbaijanBahamas, TheBahrainBangladeshBarbadosBelarusBelgiumBelizeBeninBermudaBoliviaBosnia and HerzegovinaBrazilBrunei DarussalamBulgariaBurkina FasoBurundiCabo VerdeCambodiaCameroonCanadaCaribbean small statesCentral African RepublicCentral Europe and the BalticsChadChileChinaColombiaComorosCongo, Dem. Rep.Congo, Rep.Costa RicaCote d'IvoireCroatiaCubaCyprusCzech RepublicDenmarkDjiboutiDominicaDominican RepublicEarly-demographic dividendEast Asia & PacificEast Asia & Pacific (excluding high income)East Asia & Pacific (IDA & IBRD countries)EcuadorEgypt, Arab Rep.El SalvadorEquatorial GuineaEstoniaEthiopiaEuro areaEurope & Central AsiaEurope & Central Asia (excluding high income)Europe & Central Asia (IDA & IBRD countries)European UnionFijiFinlandFragile and conflict affected situationsFranceGabonGambia, TheGeorgiaGermanyGhanaGreeceGreenlandGrenadaGuatemalaGuineaGuinea-BissauGuyanaHaitiHeavily indebted poor countries (HIPC)High incomeHondurasHong Kong SAR, ChinaHungaryIBRD onlyIcelandIDA & IBRD totalIDA blendIDA onlyIDA totalIndiaIndonesiaIran, Islamic Rep.IraqIrelandIsraelItalyJamaicaJapanJordanKazakhstanKenyaKorea, Dem. People’s Rep.Korea, Rep.KosovoKuwaitKyrgyz RepublicLao PDRLate-demographic dividendLatin America & Caribbean Latin America & Caribbean (excluding high income)Latin America & the Caribbean (IDA & IBRD countries)LatviaLeast developed countries: UN classificationLebanonLiberiaLibyaLithuaniaLow & middle incomeLow incomeLower middle incomeLuxembourgMacao SAR, ChinaMacedonia, FYRMadagascarMalawiMalaysiaMaliMaltaMauritaniaMauritiusMexicoMiddle East & North AfricaMiddle East & North Africa (excluding high income)Middle East & North Africa (IDA & IBRD countries)Middle incomeMoldovaMongoliaMontenegroMoroccoMozambiqueMyanmarNepalNetherlandsNew CaledoniaNew ZealandNicaraguaNigerNigeriaNorth AmericaNorwayOECD membersOmanOther small statesPacific island small statesPakistanPanamaPapua New GuineaParaguayPeruPhilippinesPolandPortugalPost-demographic dividendPre-demographic dividendQatarRomaniaRussian FederationRwandaSamoaSaudi ArabiaSenegalSerbiaSeychellesSierra LeoneSingaporeSlovak RepublicSloveniaSmall statesSomaliaSouth AfricaSouth AsiaSouth Asia (IDA & IBRD)SpainSri LankaSt. LuciaSub-Saharan Africa Sub-Saharan Africa (excluding high income)Sub-Saharan Africa (IDA & IBRD countries)SudanSurinameSwedenSwitzerlandSyrian Arab RepublicTajikistanTanzaniaThailandTogoTrinidad and TobagoTunisiaTurkeyTurkmenistanUgandaUkraineUnited Arab EmiratesUnited KingdomUnited StatesUpper middle incomeUruguayUzbekistanVenezuela, RBVietnamWorldYemen, Rep.ZambiaZimbabwe Linha do tempo:
Nesta escala de tempo está apresentado um gráfico de 1974 ano até 2015 ano Kuwait. Dados de 1973 ano ausente. O número de observações reais por data: 42.
Fonte (nome):
Indicadores de desenvolvimento mundial
Fonte (organização):
World Bank staff estimates based data from International Monetary Fund's Direction of Trade database.
Categorias:
Private Sector, Trade
Foi atualizado:
23 abr 2017 ano
Indicadores de alterações dos valores ao longo dos anos
Mínimo:
0.386
1 jan 1995 ano
Máximo:
21.203
1 jan 1992 ano
Na data de observação
Valor
Mudança absoluta
A alteração em relação ao valor anterior
1 jan 1974 ano
1.321
+1.321
0.0%
1 jan 1975 ano
0.964
-0.357
-27.04%
1 jan 1976 ano
5.102
+4.138
429.47%
1 jan 1977 ano
1.894
-3.208
-62.87%
1 jan 1978 ano
1.778
-0.116
-6.12%
1 jan 1979 ano
2.322
+0.544
30.57%
1 jan 1980 ano
3.029
+0.707
30.47%
1 jan 1981 ano
3.986
+0.956
31.57%
1 jan 1982 ano
8.451
+4.465
112.04%
1 jan 1983 ano
10.472
+2.021
23.91%
1 jan 1984 ano
6.505
-3.967
-37.88%
1 jan 1985 ano
5.609
-0.896
-13.77%
1 jan 1986 ano
6.121
+0.512
9.13%
1 jan 1987 ano
5.991
-0.131
-2.13%
1 jan 1988 ano
4.95
-1.041
-17.38%
1 jan 1989 ano
6.743
+1.793
36.23%
1 jan 1990 ano
5.221
-1.521
-22.57%
1 jan 1991 ano
5.346
+0.124
2.38%
1 jan 1992 ano
21.203
+15.857
296.64%
1 jan 1993 ano
2.209
-18.994
-89.58%
1 jan 1994 ano
1.126
-1.082
-49.0%
1 jan 1995 ano
0.386
-0.741
-65.77%
1 jan 1996 ano
0.719
+0.334
86.58%
1 jan 1997 ano
0.396
-0.324
-44.98%
1 jan 1998 ano
0.807
+0.411
103.93%
1 jan 1999 ano
0.858
+0.05
6.25%
1 jan 2000 ano
1.294
+0.436
50.9%
1 jan 2001 ano
1.025
-0.269
-20.79%
1 jan 2002 ano
1.525
+0.5
48.76%
1 jan 2003 ano
1.62
+0.095
6.22%
1 jan 2004 ano
1.487
-0.133
-8.19%
1 jan 2005 ano
2.212
+0.725
48.74%
1 jan 2006 ano
4.202
+1.99
89.99%
1 jan 2007 ano
4.11
-0.092
-2.2%
1 jan 2008 ano
4.413
+0.303
7.38%
1 jan 2009 ano
4.127
-0.286
-6.49%
1 jan 2010 ano
4.527
+0.401
9.71%
1 jan 2011 ano
4.614
+0.086
1.9%
1 jan 2012 ano
4.912
+0.299
6.47%
1 jan 2013 ano
4.389
-0.524
-10.66%
1 jan 2014 ano
4.517
+0.128
2.92%
1 jan 2015 ano
5.465
+0.948
20.99%
Classificação de países por estatísticas atuais por anos


Comentários: