29
/pt/
pt
AIzaSyAYiBZKx7MnpbEhh9jyipgxe19OcubqV5w
April 1, 2024
188072
Malaysia
MYS
true
2
1
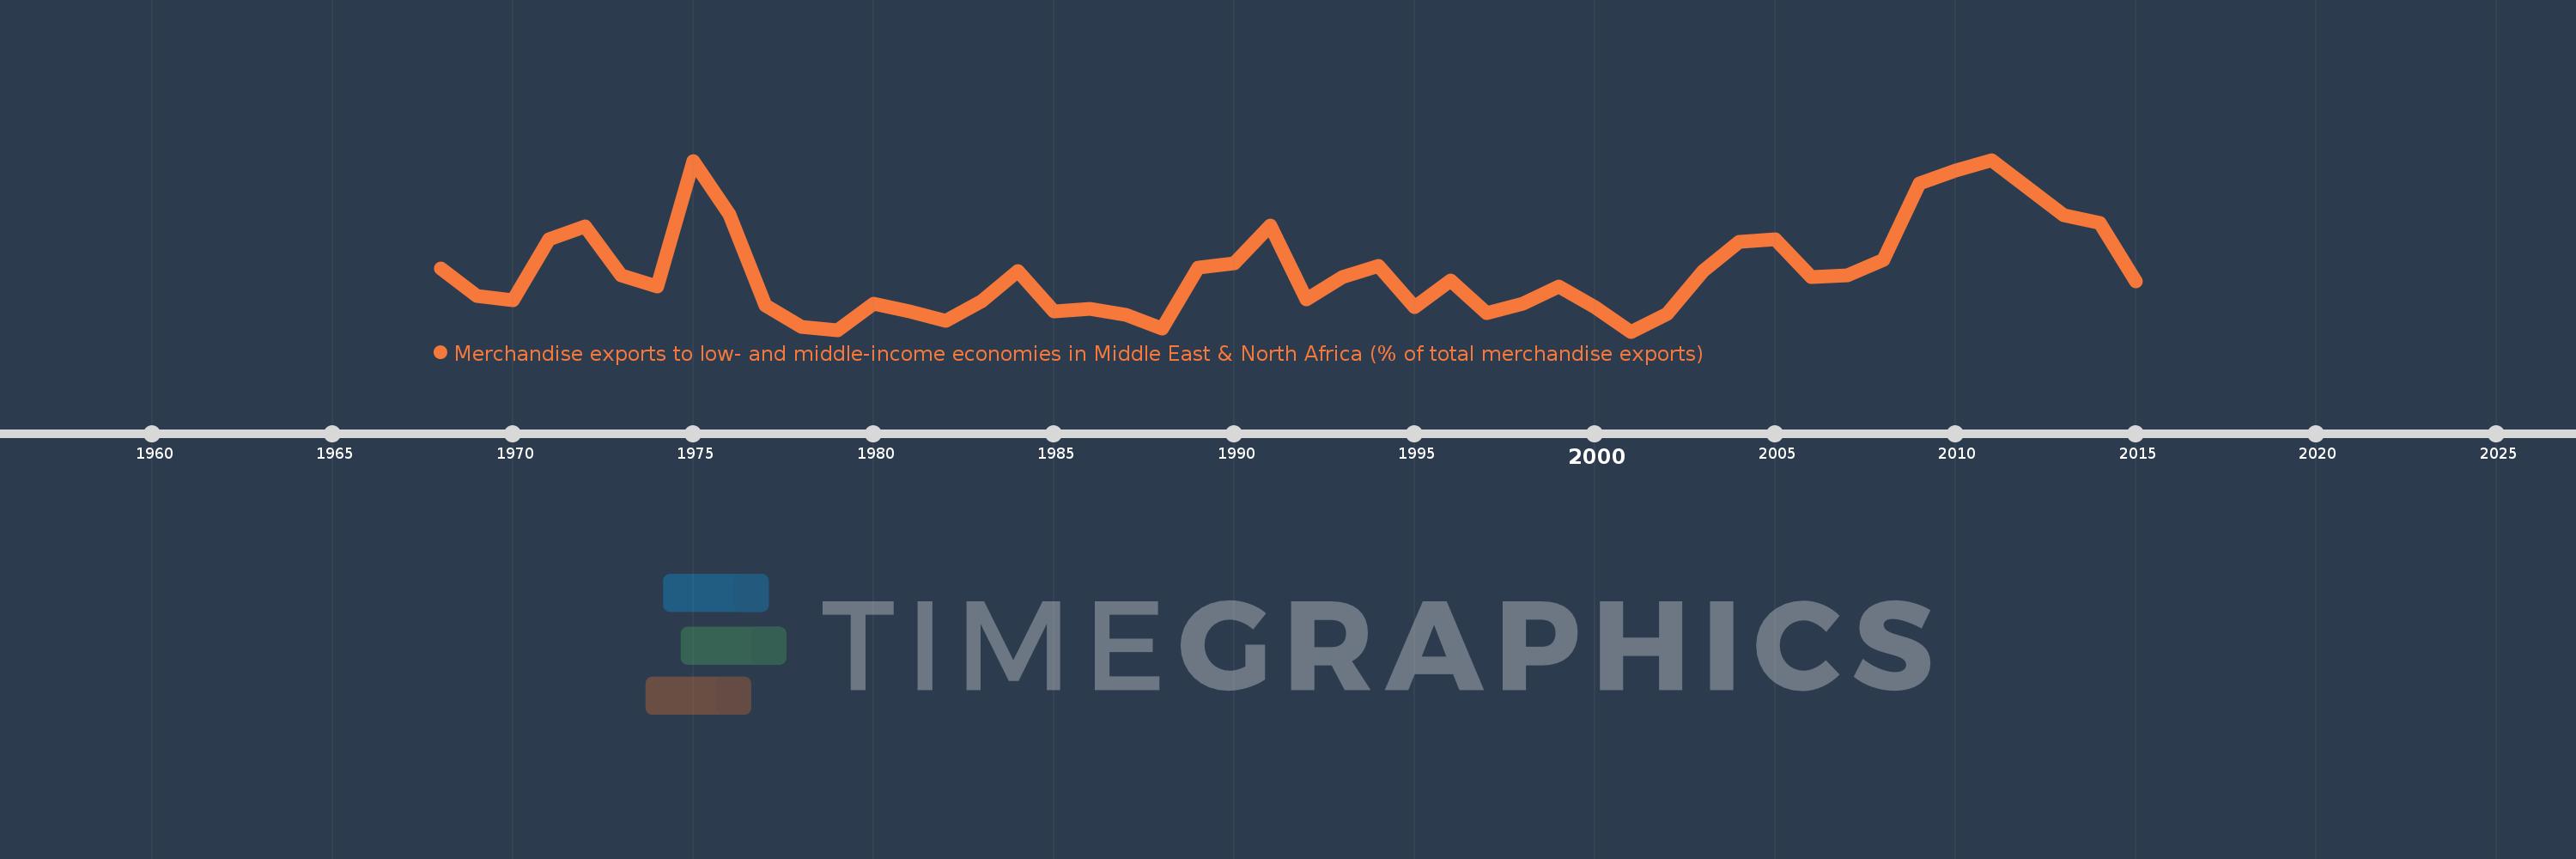
Merchandise exports to low- and middle-income economies in Middle East & North Africa (% of total merchandise exports)
2015,2014,2013,2012,2011,2010,2009,2008,2007,2006,2005,2004,2003,2002,2001,2000,1999,1998,1997,1996,1995,1994,1993,1992,1991,1990,1989,1988,1987,1986,1985,1984,1983,1982,1981,1980,1979,1978,1977,1976,1975,1974,1973,1972,1971,1970,1969,1968
Estas estatísticas em outros países:
AfghanistanAlbaniaAlgeriaAngolaArab WorldArgentinaArmeniaArubaAustraliaAustriaAzerbaijanBahamas, TheBahrainBangladeshBarbadosBelarusBelgiumBelizeBeninBermudaBoliviaBosnia and HerzegovinaBrazilBrunei DarussalamBulgariaBurkina FasoBurundiCabo VerdeCambodiaCameroonCanadaCaribbean small statesCentral African RepublicCentral Europe and the BalticsChadChileChinaColombiaComorosCongo, Dem. Rep.Congo, Rep.Costa RicaCote d'IvoireCroatiaCubaCyprusCzech RepublicDenmarkDjiboutiDominicaDominican RepublicEarly-demographic dividendEast Asia & PacificEast Asia & Pacific (excluding high income)East Asia & Pacific (IDA & IBRD countries)EcuadorEgypt, Arab Rep.El SalvadorEquatorial GuineaEstoniaEthiopiaEuro areaEurope & Central AsiaEurope & Central Asia (excluding high income)Europe & Central Asia (IDA & IBRD countries)European UnionFijiFinlandFragile and conflict affected situationsFranceGabonGambia, TheGeorgiaGermanyGhanaGreeceGreenlandGrenadaGuatemalaGuineaGuinea-BissauGuyanaHaitiHeavily indebted poor countries (HIPC)High incomeHondurasHong Kong SAR, ChinaHungaryIBRD onlyIcelandIDA & IBRD totalIDA blendIDA onlyIDA totalIndiaIndonesiaIran, Islamic Rep.IraqIrelandIsraelItalyJamaicaJapanJordanKazakhstanKenyaKorea, Dem. People’s Rep.Korea, Rep.KosovoKuwaitKyrgyz RepublicLao PDRLate-demographic dividendLatin America & Caribbean Latin America & Caribbean (excluding high income)Latin America & the Caribbean (IDA & IBRD countries)LatviaLeast developed countries: UN classificationLebanonLiberiaLibyaLithuaniaLow & middle incomeLow incomeLower middle incomeLuxembourgMacao SAR, ChinaMacedonia, FYRMadagascarMalawiMalaysiaMaliMaltaMauritaniaMauritiusMexicoMiddle East & North AfricaMiddle East & North Africa (excluding high income)Middle East & North Africa (IDA & IBRD countries)Middle incomeMoldovaMongoliaMontenegroMoroccoMozambiqueMyanmarNepalNetherlandsNew CaledoniaNew ZealandNicaraguaNigerNigeriaNorth AmericaNorwayOECD membersOmanOther small statesPacific island small statesPakistanPanamaPapua New GuineaParaguayPeruPhilippinesPolandPortugalPost-demographic dividendPre-demographic dividendQatarRomaniaRussian FederationRwandaSamoaSaudi ArabiaSenegalSerbiaSeychellesSierra LeoneSingaporeSlovak RepublicSloveniaSmall statesSomaliaSouth AfricaSouth AsiaSouth Asia (IDA & IBRD)SpainSri LankaSt. LuciaSub-Saharan Africa Sub-Saharan Africa (excluding high income)Sub-Saharan Africa (IDA & IBRD countries)SudanSurinameSwedenSwitzerlandSyrian Arab RepublicTajikistanTanzaniaThailandTogoTrinidad and TobagoTunisiaTurkeyTurkmenistanUgandaUkraineUnited Arab EmiratesUnited KingdomUnited StatesUpper middle incomeUruguayUzbekistanVenezuela, RBVietnamWorldYemen, Rep.ZambiaZimbabwe Linha do tempo:
Nesta escala de tempo está apresentado um gráfico de 1968 ano até 2015 ano Malaysia. Dados de 1967 ano ausente. O número de observações reais por data: 48.
Fonte (nome):
Indicadores de desenvolvimento mundial
Fonte (organização):
World Bank staff estimates based data from International Monetary Fund's Direction of Trade database.
Categorias:
Private Sector, Trade
Foi atualizado:
23 abr 2017 ano
Indicadores de alterações dos valores ao longo dos anos
Mínimo:
0.663
1 jan 2001 ano
Máximo:
1.804
1 jan 2011 ano
Na data de observação
Valor
Mudança absoluta
A alteração em relação ao valor anterior
1 jan 1968 ano
1.085
+1.085
0.0%
1 jan 1969 ano
0.897
-0.188
-17.37%
1 jan 1970 ano
0.874
-0.023
-2.53%
1 jan 1971 ano
1.277
+0.403
46.14%
1 jan 1972 ano
1.36
+0.083
6.49%
1 jan 1973 ano
1.038
-0.322
-23.68%
1 jan 1974 ano
0.962
-0.076
-7.31%
1 jan 1975 ano
1.798
+0.835
86.82%
1 jan 1976 ano
1.443
-0.355
-19.73%
1 jan 1977 ano
0.839
-0.604
-41.86%
1 jan 1978 ano
0.697
-0.142
-16.98%
1 jan 1979 ano
0.674
-0.022
-3.21%
1 jan 1980 ano
0.847
+0.173
25.66%
1 jan 1981 ano
0.795
-0.052
-6.19%
1 jan 1982 ano
0.734
-0.061
-7.7%
1 jan 1983 ano
0.863
+0.13
17.72%
1 jan 1984 ano
1.064
+0.2
23.19%
1 jan 1985 ano
0.797
-0.267
-25.07%
1 jan 1986 ano
0.815
+0.018
2.3%
1 jan 1987 ano
0.777
-0.038
-4.69%
1 jan 1988 ano
0.681
-0.096
-12.37%
1 jan 1989 ano
1.089
+0.408
59.97%
1 jan 1990 ano
1.117
+0.027
2.52%
1 jan 1991 ano
1.365
+0.248
22.21%
1 jan 1992 ano
0.877
-0.487
-35.7%
1 jan 1993 ano
1.027
+0.15
17.08%
1 jan 1994 ano
1.101
+0.073
7.15%
1 jan 1995 ano
0.827
-0.274
-24.89%
1 jan 1996 ano
1.002
+0.175
21.16%
1 jan 1997 ano
0.788
-0.214
-21.34%
1 jan 1998 ano
0.846
+0.058
7.35%
1 jan 1999 ano
0.964
+0.119
14.01%
1 jan 2000 ano
0.827
-0.137
-14.21%
1 jan 2001 ano
0.663
-0.165
-19.88%
1 jan 2002 ano
0.779
+0.116
17.45%
1 jan 2003 ano
1.063
+0.284
36.5%
1 jan 2004 ano
1.26
+0.197
18.57%
1 jan 2005 ano
1.277
+0.017
1.32%
1 jan 2006 ano
1.023
-0.253
-19.84%
1 jan 2007 ano
1.034
+0.01
1.0%
1 jan 2008 ano
1.137
+0.103
10.0%
1 jan 2009 ano
1.647
+0.51
44.84%
1 jan 2010 ano
1.731
+0.084
5.1%
1 jan 2011 ano
1.804
+0.073
4.22%
1 jan 2012 ano
1.617
-0.187
-10.37%
1 jan 2013 ano
1.438
-0.179
-11.05%
1 jan 2014 ano
1.386
-0.052
-3.6%
1 jan 2015 ano
0.994
-0.393
-28.34%
Classificação de países por estatísticas atuais por anos


Comentários: