29
/pt/
pt
AIzaSyAYiBZKx7MnpbEhh9jyipgxe19OcubqV5w
April 1, 2024
29274
East Asia & Pacific (IDA & IBRD countries)
TEA
false
2
1
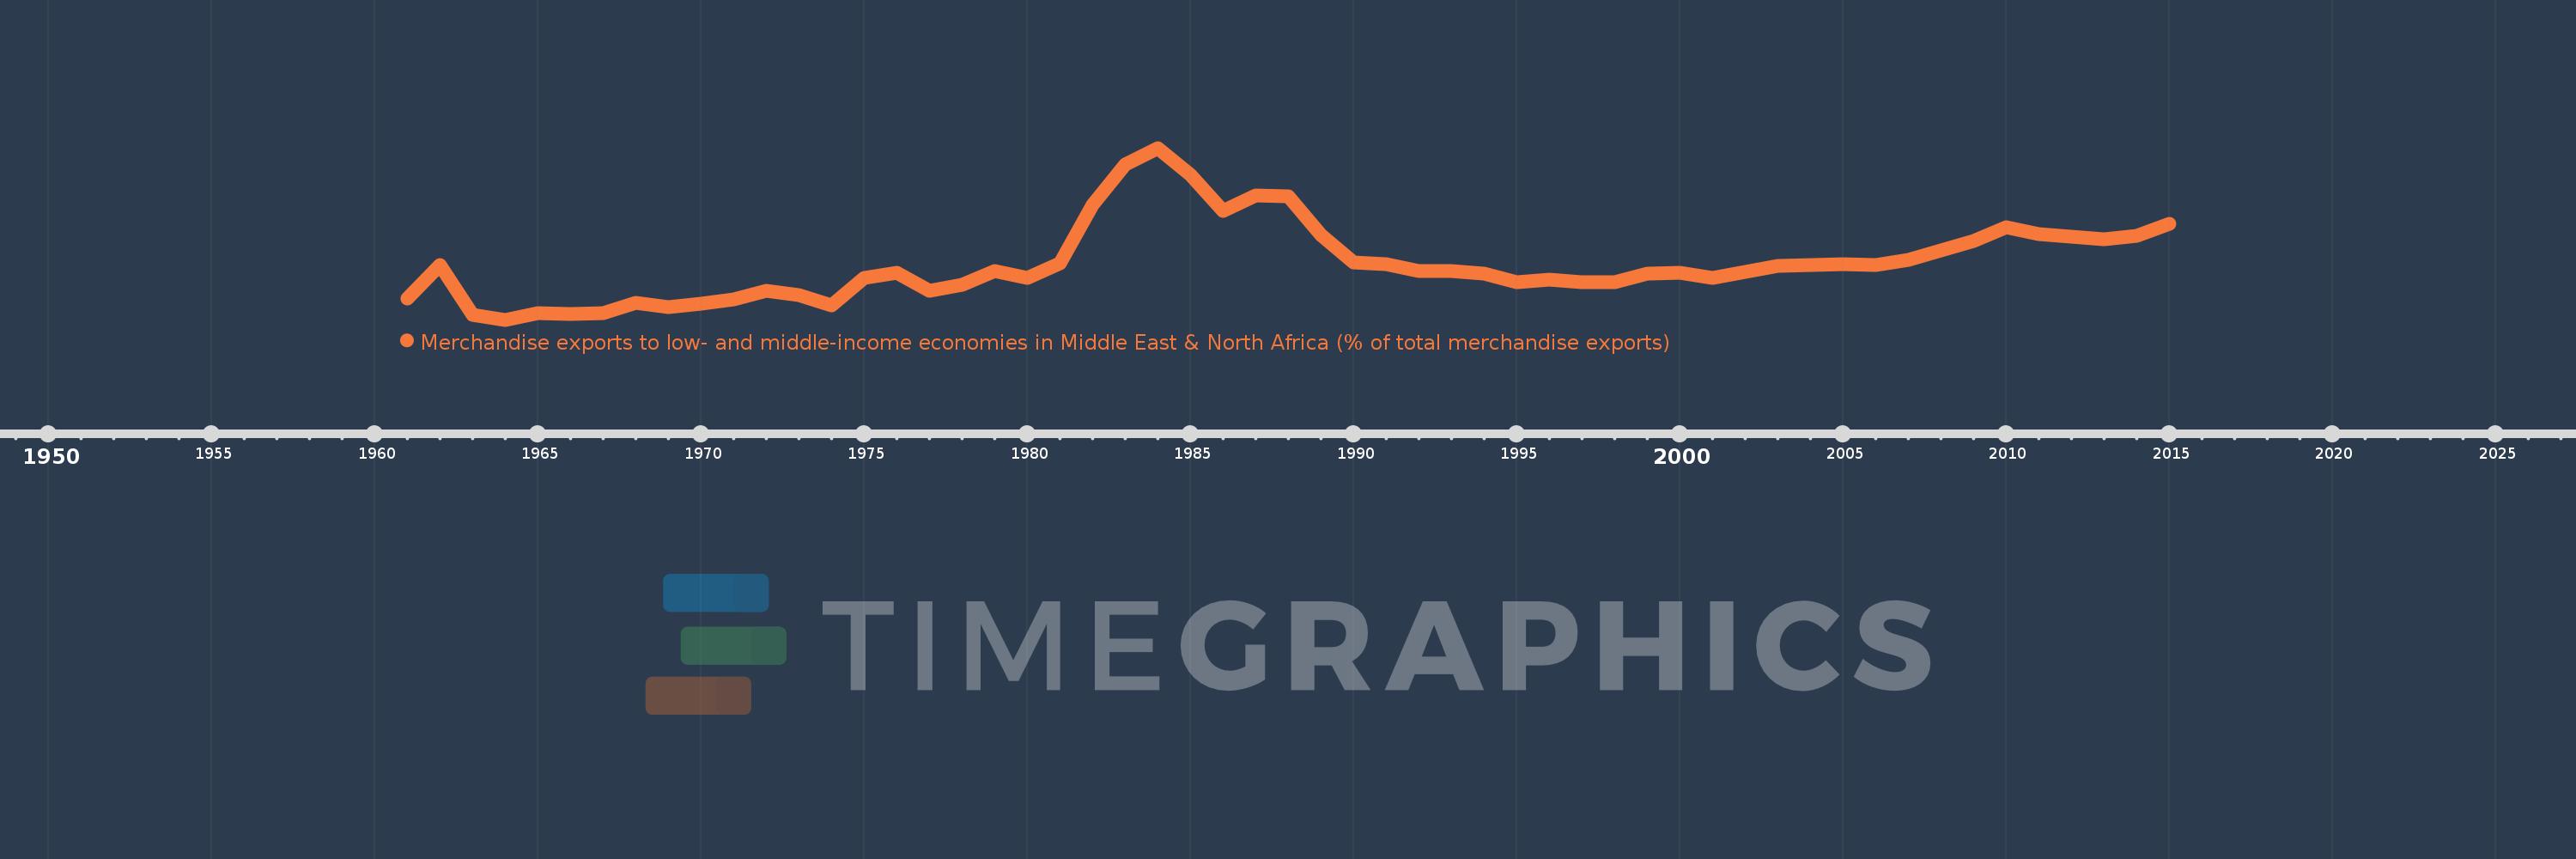
Merchandise exports to low- and middle-income economies in Middle East & North Africa (% of total merchandise exports)
2015,2014,2013,2012,2011,2010,2009,2008,2007,2006,2005,2004,2003,2002,2001,2000,1999,1998,1997,1996,1995,1994,1993,1992,1991,1990,1989,1988,1987,1986,1985,1984,1983,1982,1981,1980,1979,1978,1977,1976,1975,1974,1973,1972,1971,1970,1969,1968,1967,1966,1965,1964,1963,1962,1961
Estas estatísticas em outros países:
AfghanistanAlbaniaAlgeriaAngolaArab WorldArgentinaArmeniaArubaAustraliaAustriaAzerbaijanBahamas, TheBahrainBangladeshBarbadosBelarusBelgiumBelizeBeninBermudaBoliviaBosnia and HerzegovinaBrazilBrunei DarussalamBulgariaBurkina FasoBurundiCabo VerdeCambodiaCameroonCanadaCaribbean small statesCentral African RepublicCentral Europe and the BalticsChadChileChinaColombiaComorosCongo, Dem. Rep.Congo, Rep.Costa RicaCote d'IvoireCroatiaCubaCyprusCzech RepublicDenmarkDjiboutiDominicaDominican RepublicEarly-demographic dividendEast Asia & PacificEast Asia & Pacific (excluding high income)East Asia & Pacific (IDA & IBRD countries)EcuadorEgypt, Arab Rep.El SalvadorEquatorial GuineaEstoniaEthiopiaEuro areaEurope & Central AsiaEurope & Central Asia (excluding high income)Europe & Central Asia (IDA & IBRD countries)European UnionFijiFinlandFragile and conflict affected situationsFranceGabonGambia, TheGeorgiaGermanyGhanaGreeceGreenlandGrenadaGuatemalaGuineaGuinea-BissauGuyanaHaitiHeavily indebted poor countries (HIPC)High incomeHondurasHong Kong SAR, ChinaHungaryIBRD onlyIcelandIDA & IBRD totalIDA blendIDA onlyIDA totalIndiaIndonesiaIran, Islamic Rep.IraqIrelandIsraelItalyJamaicaJapanJordanKazakhstanKenyaKorea, Dem. People’s Rep.Korea, Rep.KosovoKuwaitKyrgyz RepublicLao PDRLate-demographic dividendLatin America & Caribbean Latin America & Caribbean (excluding high income)Latin America & the Caribbean (IDA & IBRD countries)LatviaLeast developed countries: UN classificationLebanonLiberiaLibyaLithuaniaLow & middle incomeLow incomeLower middle incomeLuxembourgMacao SAR, ChinaMacedonia, FYRMadagascarMalawiMalaysiaMaliMaltaMauritaniaMauritiusMexicoMiddle East & North AfricaMiddle East & North Africa (excluding high income)Middle East & North Africa (IDA & IBRD countries)Middle incomeMoldovaMongoliaMontenegroMoroccoMozambiqueMyanmarNepalNetherlandsNew CaledoniaNew ZealandNicaraguaNigerNigeriaNorth AmericaNorwayOECD membersOmanOther small statesPacific island small statesPakistanPanamaPapua New GuineaParaguayPeruPhilippinesPolandPortugalPost-demographic dividendPre-demographic dividendQatarRomaniaRussian FederationRwandaSamoaSaudi ArabiaSenegalSerbiaSeychellesSierra LeoneSingaporeSlovak RepublicSloveniaSmall statesSomaliaSouth AfricaSouth AsiaSouth Asia (IDA & IBRD)SpainSri LankaSt. LuciaSub-Saharan Africa Sub-Saharan Africa (excluding high income)Sub-Saharan Africa (IDA & IBRD countries)SudanSurinameSwedenSwitzerlandSyrian Arab RepublicTajikistanTanzaniaThailandTogoTrinidad and TobagoTunisiaTurkeyTurkmenistanUgandaUkraineUnited Arab EmiratesUnited KingdomUnited StatesUpper middle incomeUruguayUzbekistanVenezuela, RBVietnamWorldYemen, Rep.ZambiaZimbabwe Linha do tempo:
Nesta escala de tempo está apresentado um gráfico de 1961 ano até 2015 ano East Asia & Pacific (IDA & IBRD countries). Dados de 1960 ano ausente. O número de observações reais por data: 55.
Fonte (nome):
Indicadores de desenvolvimento mundial
Fonte (organização):
World Bank staff estimates based data from International Monetary Fund's Direction of Trade database.
Categorias:
Private Sector, Trade
Foi atualizado:
23 abr 2017 ano
Indicadores de alterações dos valores ao longo dos anos
Mínimo:
0.063
1 jan 1964 ano
Máximo:
4.103
1 jan 1984 ano
Na data de observação
Valor
Mudança absoluta
A alteração em relação ao valor anterior
1 jan 1961 ano
0.566
+0.566
0.0%
1 jan 1962 ano
1.34
+0.774
136.7%
1 jan 1963 ano
0.171
-1.169
-87.23%
1 jan 1964 ano
0.063
-0.109
-63.45%
1 jan 1965 ano
0.224
+0.161
257.53%
1 jan 1966 ano
0.19
-0.034
-15.1%
1 jan 1967 ano
0.215
+0.025
13.37%
1 jan 1968 ano
0.451
+0.236
109.62%
1 jan 1969 ano
0.357
-0.094
-20.88%
1 jan 1970 ano
0.436
+0.079
22.24%
1 jan 1971 ano
0.549
+0.113
25.83%
1 jan 1972 ano
0.745
+0.196
35.61%
1 jan 1973 ano
0.634
-0.111
-14.85%
1 jan 1974 ano
0.405
-0.229
-36.14%
1 jan 1975 ano
1.05
+0.645
159.23%
1 jan 1976 ano
1.164
+0.114
10.86%
1 jan 1977 ano
0.748
-0.416
-35.73%
1 jan 1978 ano
0.881
+0.133
17.82%
1 jan 1979 ano
1.207
+0.326
37.04%
1 jan 1980 ano
1.04
-0.167
-13.87%
1 jan 1981 ano
1.385
+0.345
33.22%
1 jan 1982 ano
2.763
+1.378
99.48%
1 jan 1983 ano
3.723
+0.96
34.75%
1 jan 1984 ano
4.103
+0.379
10.19%
1 jan 1985 ano
3.469
-0.634
-15.44%
1 jan 1986 ano
2.62
-0.849
-24.48%
1 jan 1987 ano
2.987
+0.367
14.01%
1 jan 1988 ano
2.965
-0.022
-0.75%
1 jan 1989 ano
2.062
-0.903
-30.46%
1 jan 1990 ano
1.401
-0.661
-32.06%
1 jan 1991 ano
1.377
-0.024
-1.71%
1 jan 1992 ano
1.201
-0.176
-12.8%
1 jan 1993 ano
1.21
+0.009
0.78%
1 jan 1994 ano
1.156
-0.054
-4.42%
1 jan 1995 ano
0.951
-0.205
-17.76%
1 jan 1996 ano
1.014
+0.063
6.67%
1 jan 1997 ano
0.936
-0.078
-7.69%
1 jan 1998 ano
0.951
+0.015
1.6%
1 jan 1999 ano
1.138
+0.187
19.62%
1 jan 2000 ano
1.165
+0.027
2.4%
1 jan 2001 ano
1.056
-0.109
-9.39%
1 jan 2002 ano
1.191
+0.135
12.76%
1 jan 2003 ano
1.326
+0.135
11.35%
1 jan 2004 ano
1.342
+0.017
1.25%
1 jan 2005 ano
1.373
+0.03
2.25%
1 jan 2006 ano
1.358
-0.015
-1.08%
1 jan 2007 ano
1.479
+0.121
8.93%
1 jan 2008 ano
1.701
+0.222
15.02%
1 jan 2009 ano
1.921
+0.22
12.93%
1 jan 2010 ano
2.23
+0.309
16.07%
1 jan 2011 ano
2.084
-0.146
-6.54%
1 jan 2012 ano
2.012
-0.072
-3.44%
1 jan 2013 ano
1.956
-0.057
-2.82%
1 jan 2014 ano
2.045
+0.089
4.56%
1 jan 2015 ano
2.326
+0.281
13.73%
Classificação de países por estatísticas atuais por anos


Comentários: