29
/pt/
pt
AIzaSyAYiBZKx7MnpbEhh9jyipgxe19OcubqV5w
April 1, 2024
56005
Small states
SST
false
2
1
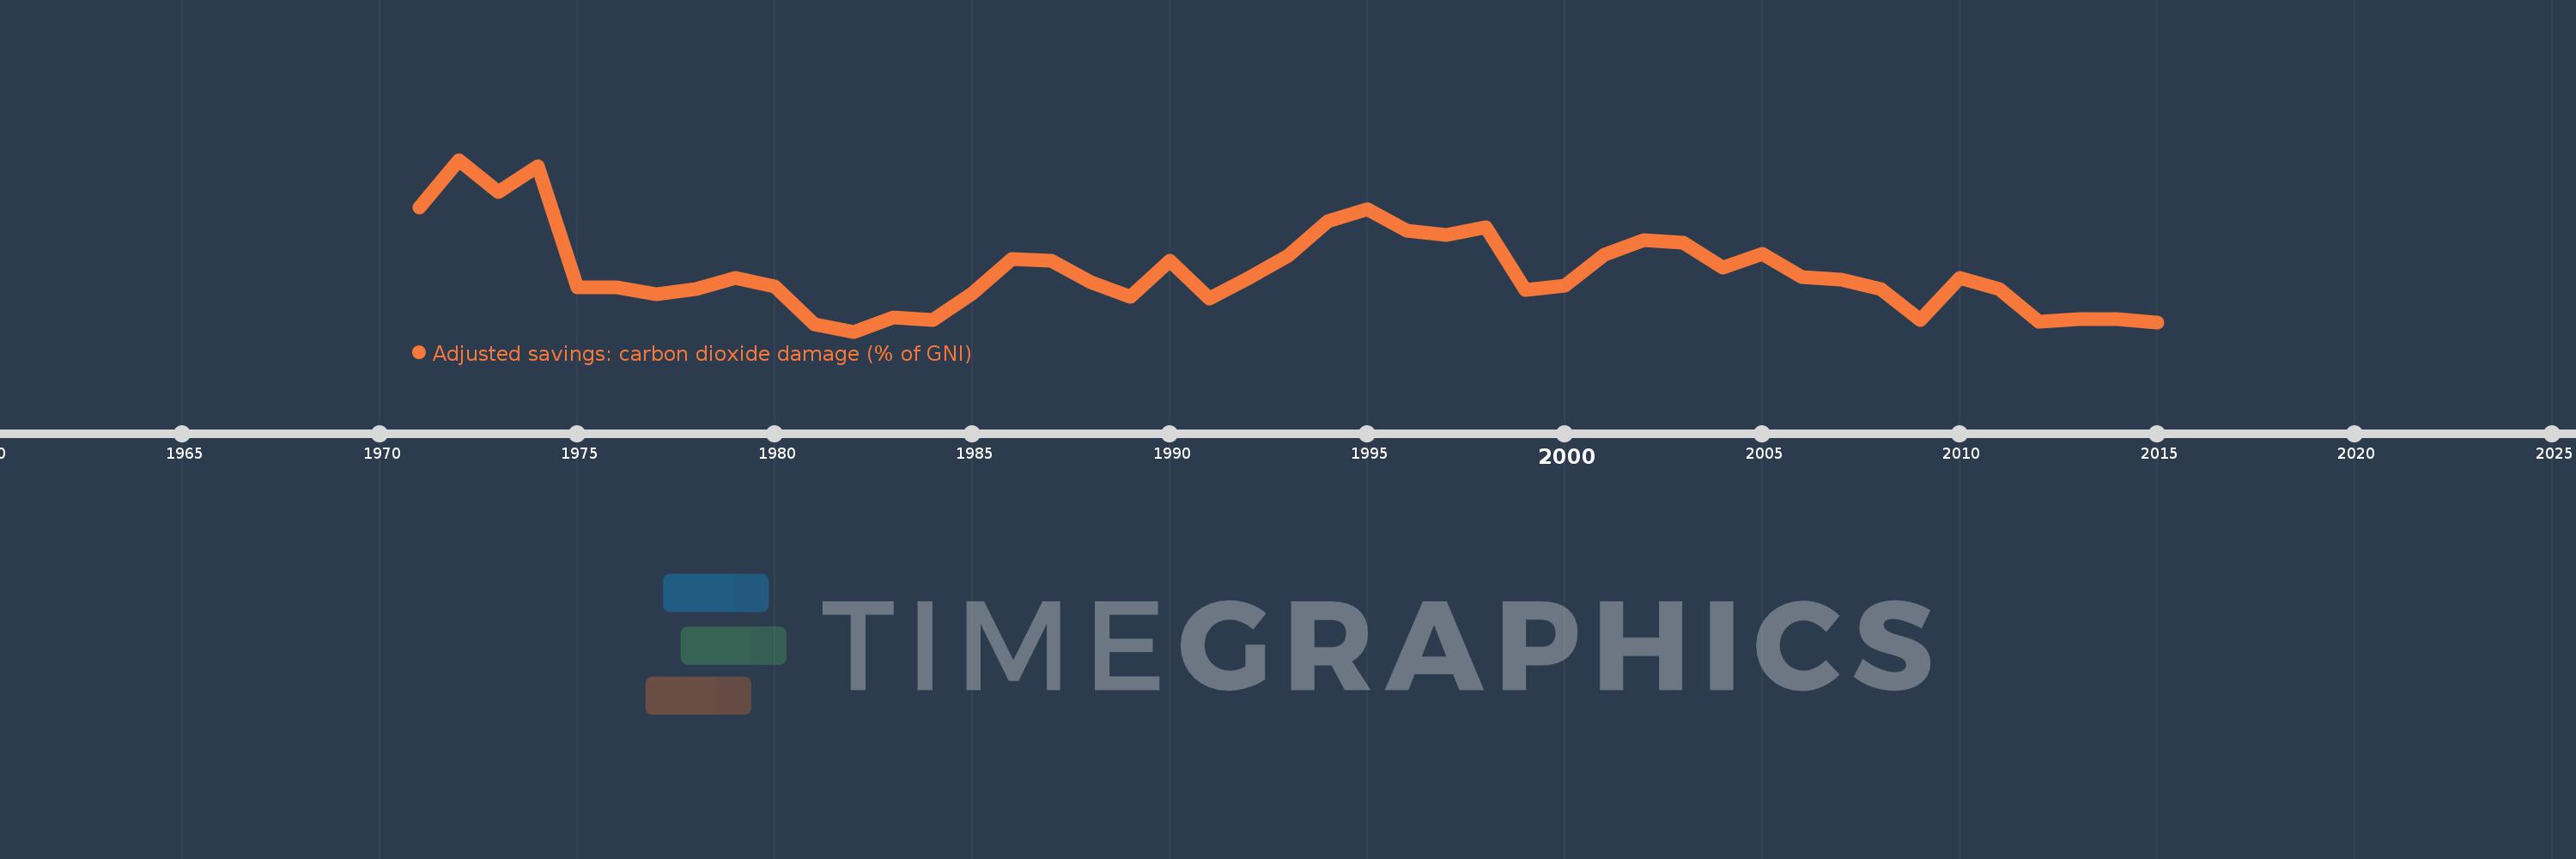
Adjusted savings: carbon dioxide damage (% of GNI)
2015,2014,2013,2012,2011,2010,2009,2008,2007,2006,2005,2004,2003,2002,2001,2000,1999,1998,1997,1996,1995,1994,1993,1992,1991,1990,1989,1988,1987,1986,1985,1984,1983,1982,1981,1980,1979,1978,1977,1976,1975,1974,1973,1972,1971
Estas estatísticas em outros países:
AfghanistanAlbaniaAlgeriaAndorraAngolaAntigua and BarbudaArab WorldArgentinaArmeniaAustraliaAustriaAzerbaijanBahamas, TheBahrainBangladeshBarbadosBelarusBelgiumBelizeBeninBermudaBhutanBoliviaBosnia and HerzegovinaBotswanaBrazilBrunei DarussalamBulgariaBurkina FasoBurundiCabo VerdeCambodiaCameroonCanadaCaribbean small statesCentral African RepublicCentral Europe and the BalticsChadChileChinaColombiaComorosCongo, Dem. Rep.Congo, Rep.Costa RicaCote d'IvoireCroatiaCubaCyprusCzech RepublicDenmarkDjiboutiDominicaDominican RepublicEarly-demographic dividendEast Asia & PacificEast Asia & Pacific (excluding high income)East Asia & Pacific (IDA & IBRD countries)EcuadorEgypt, Arab Rep.El SalvadorEquatorial GuineaEritreaEstoniaEthiopiaEuro areaEurope & Central AsiaEurope & Central Asia (excluding high income)Europe & Central Asia (IDA & IBRD countries)European UnionFaroe IslandsFijiFinlandFragile and conflict affected situationsFranceFrench PolynesiaGabonGambia, TheGeorgiaGermanyGhanaGreeceGreenlandGrenadaGuatemalaGuineaGuinea-BissauGuyanaHaitiHeavily indebted poor countries (HIPC)High incomeHondurasHong Kong SAR, ChinaHungaryIBRD onlyIcelandIDA & IBRD totalIDA blendIDA onlyIDA totalIndiaIndonesiaIran, Islamic Rep.IraqIrelandIsraelItalyJamaicaJapanJordanKazakhstanKenyaKiribatiKorea, Rep.KuwaitKyrgyz RepublicLao PDRLate-demographic dividendLatin America & Caribbean Latin America & Caribbean (excluding high income)Latin America & the Caribbean (IDA & IBRD countries)LatviaLeast developed countries: UN classificationLebanonLesothoLiberiaLibyaLiechtensteinLithuaniaLow & middle incomeLow incomeLower middle incomeLuxembourgMacao SAR, ChinaMacedonia, FYRMadagascarMalawiMalaysiaMaldivesMaliMaltaMarshall IslandsMauritaniaMauritiusMexicoMicronesia, Fed. Sts.Middle East & North AfricaMiddle East & North Africa (excluding high income)Middle East & North Africa (IDA & IBRD countries)Middle incomeMoldovaMongoliaMontenegroMoroccoMozambiqueNamibiaNepalNetherlandsNew CaledoniaNew ZealandNicaraguaNigerNigeriaNorth AmericaNorwayOECD membersOmanOther small statesPacific island small statesPakistanPalauPanamaPapua New GuineaParaguayPeruPhilippinesPolandPortugalPost-demographic dividendPre-demographic dividendQatarRomaniaRussian FederationRwandaSamoaSao Tome and PrincipeSaudi ArabiaSenegalSerbiaSeychellesSierra LeoneSingaporeSlovak RepublicSloveniaSmall statesSolomon IslandsSouth AfricaSouth AsiaSouth Asia (IDA & IBRD)SpainSri LankaSt. Kitts and NevisSt. LuciaSt. Vincent and the GrenadinesSub-Saharan Africa Sub-Saharan Africa (excluding high income)Sub-Saharan Africa (IDA & IBRD countries)SudanSurinameSwazilandSwedenSwitzerlandSyrian Arab RepublicTajikistanTanzaniaThailandTimor-LesteTogoTongaTrinidad and TobagoTunisiaTurkeyTurkmenistanUgandaUkraineUnited Arab EmiratesUnited KingdomUnited StatesUpper middle incomeUruguayUzbekistanVanuatuVenezuela, RBVietnamWest Bank and GazaWorldYemen, Rep.ZambiaZimbabwe Linha do tempo:
Nesta escala de tempo está apresentado um gráfico de 1971 ano até 2015 ano Small states. Dados de 1970 ano ausente. O número de observações reais por data: 45.
Fonte (nome):
Indicadores de desenvolvimento mundial
Fonte (organização):
World Bank staff estimates based on Samuel Fankhauser's "Valuing Climate Change: The Economics of the Greenhouse" (1995).
Categorias:
Economy & Growth, Environment
Foi atualizado:
23 abr 2017 ano
Indicadores de alterações dos valores ao longo dos anos
Mínimo:
0.539
1 jan 1982 ano
Máximo:
0.979
1 jan 1972 ano
Na data de observação
Valor
Mudança absoluta
A alteração em relação ao valor anterior
1 jan 1971 ano
0.856
+0.856
0.0%
1 jan 1972 ano
0.979
+0.123
14.38%
1 jan 1973 ano
0.896
-0.083
-8.46%
1 jan 1974 ano
0.963
+0.067
7.49%
1 jan 1975 ano
0.653
-0.309
-32.14%
1 jan 1976 ano
0.653
-0.001
-0.08%
1 jan 1977 ano
0.635
-0.018
-2.76%
1 jan 1978 ano
0.647
+0.012
1.95%
1 jan 1979 ano
0.676
+0.028
4.38%
1 jan 1980 ano
0.655
-0.021
-3.08%
1 jan 1981 ano
0.557
-0.098
-15.0%
1 jan 1982 ano
0.539
-0.018
-3.26%
1 jan 1983 ano
0.576
+0.038
6.97%
1 jan 1984 ano
0.569
-0.007
-1.19%
1 jan 1985 ano
0.636
+0.067
11.81%
1 jan 1986 ano
0.724
+0.087
13.71%
1 jan 1987 ano
0.72
-0.004
-0.56%
1 jan 1988 ano
0.666
-0.054
-7.44%
1 jan 1989 ano
0.628
-0.038
-5.7%
1 jan 1990 ano
0.72
+0.092
14.58%
1 jan 1991 ano
0.624
-0.096
-13.31%
1 jan 1992 ano
0.676
+0.052
8.31%
1 jan 1993 ano
0.734
+0.058
8.62%
1 jan 1994 ano
0.822
+0.088
12.04%
1 jan 1995 ano
0.852
+0.03
3.59%
1 jan 1996 ano
0.798
-0.053
-6.27%
1 jan 1997 ano
0.786
-0.012
-1.56%
1 jan 1998 ano
0.806
+0.02
2.58%
1 jan 1999 ano
0.646
-0.161
-19.91%
1 jan 2000 ano
0.657
+0.012
1.8%
1 jan 2001 ano
0.737
+0.079
12.03%
1 jan 2002 ano
0.773
+0.036
4.95%
1 jan 2003 ano
0.766
-0.007
-0.95%
1 jan 2004 ano
0.702
-0.064
-8.36%
1 jan 2005 ano
0.738
+0.036
5.12%
1 jan 2006 ano
0.679
-0.059
-7.99%
1 jan 2007 ano
0.673
-0.005
-0.81%
1 jan 2008 ano
0.649
-0.024
-3.62%
1 jan 2009 ano
0.568
-0.081
-12.46%
1 jan 2010 ano
0.677
+0.109
19.25%
1 jan 2011 ano
0.649
-0.029
-4.22%
1 jan 2012 ano
0.564
-0.085
-13.04%
1 jan 2013 ano
0.57
+0.006
1.06%
1 jan 2014 ano
0.571
+0.001
0.13%
1 jan 2015 ano
0.562
-0.009
-1.56%
Classificação de países por estatísticas atuais por anos


Comentários: