29
/pt/
pt
AIzaSyAYiBZKx7MnpbEhh9jyipgxe19OcubqV5w
April 1, 2024
156928
Iran, Islamic Rep.
IRN
true
2
1
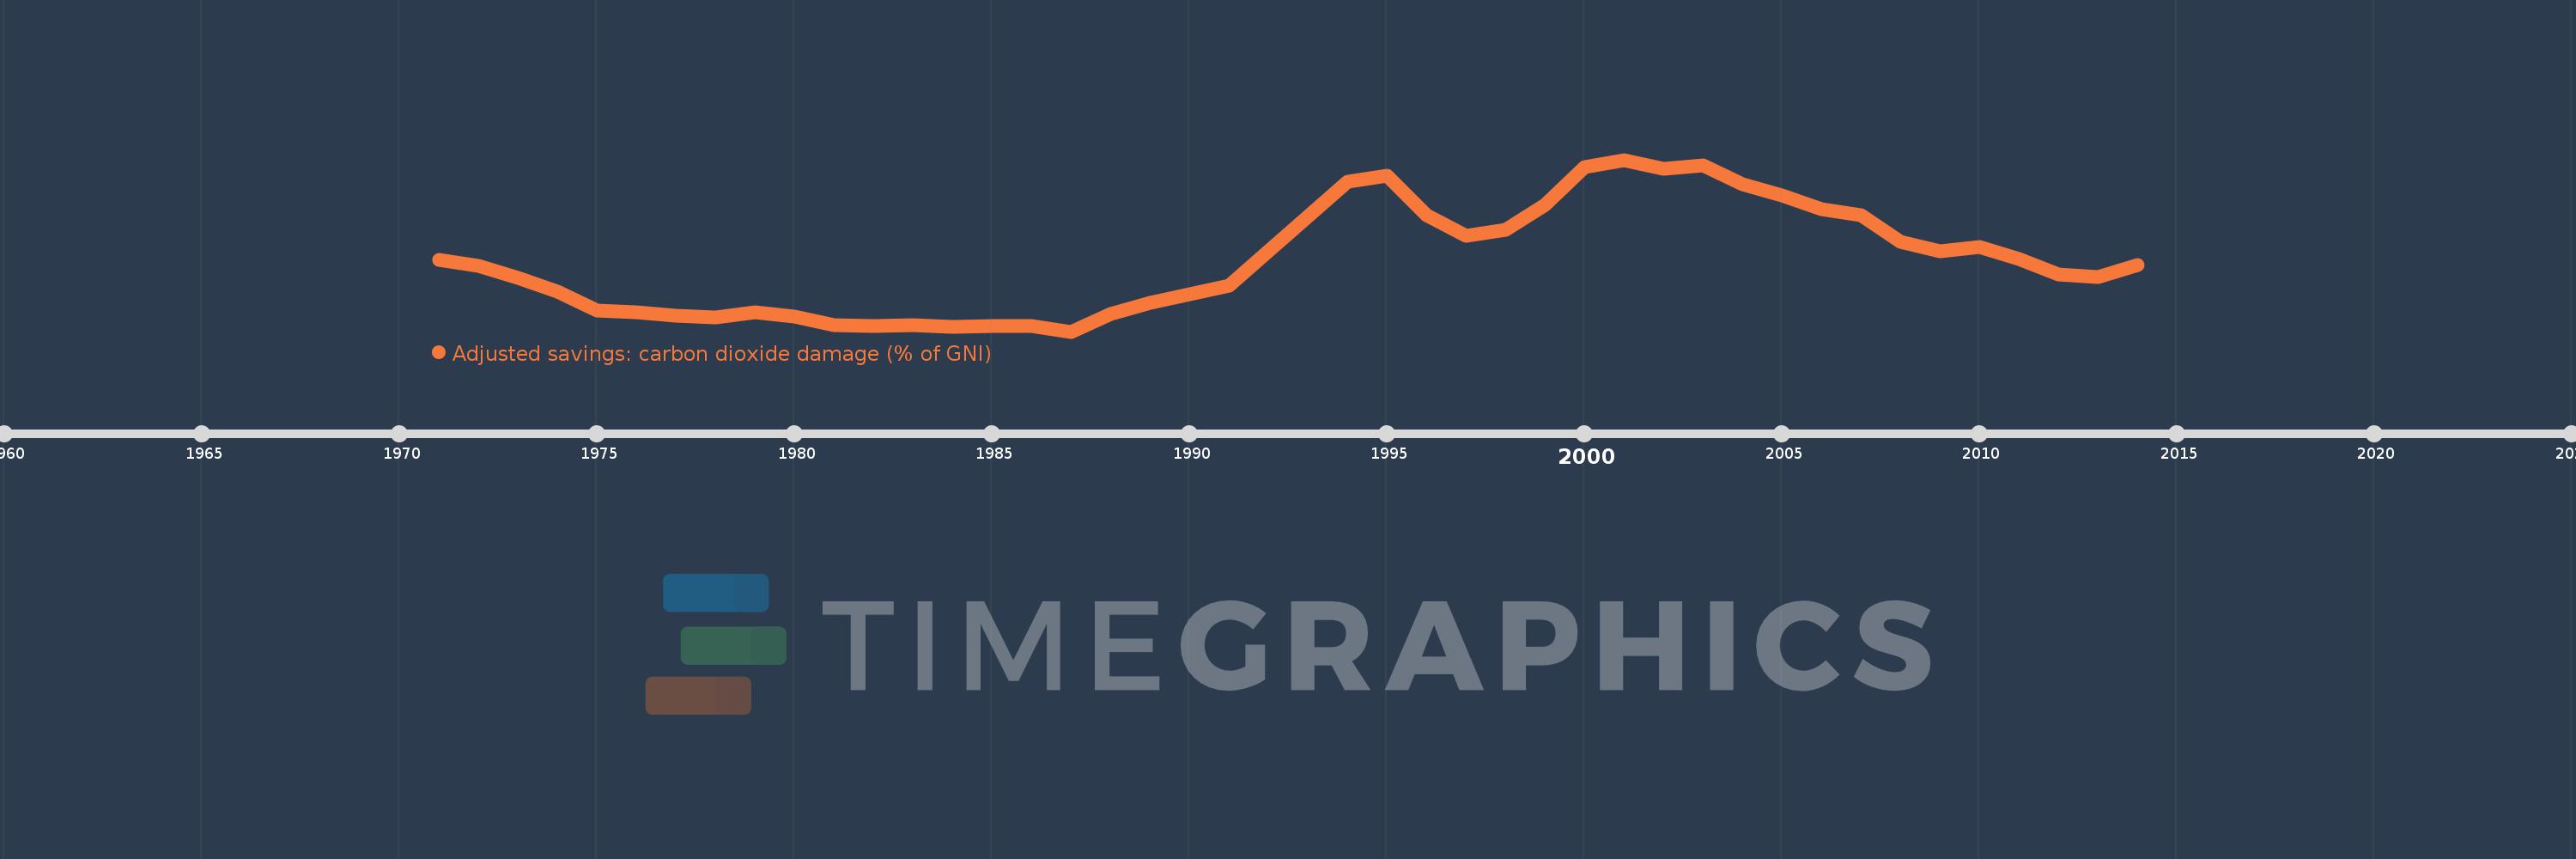
Adjusted savings: carbon dioxide damage (% of GNI)
2014,2013,2012,2011,2010,2009,2008,2007,2006,2005,2004,2003,2002,2001,2000,1999,1998,1997,1996,1995,1994,1991,1990,1989,1988,1987,1986,1985,1984,1983,1982,1981,1980,1979,1978,1977,1976,1975,1974,1973,1972,1971
Estas estatísticas em outros países:
AfghanistanAlbaniaAlgeriaAndorraAngolaAntigua and BarbudaArab WorldArgentinaArmeniaAustraliaAustriaAzerbaijanBahamas, TheBahrainBangladeshBarbadosBelarusBelgiumBelizeBeninBermudaBhutanBoliviaBosnia and HerzegovinaBotswanaBrazilBrunei DarussalamBulgariaBurkina FasoBurundiCabo VerdeCambodiaCameroonCanadaCaribbean small statesCentral African RepublicCentral Europe and the BalticsChadChileChinaColombiaComorosCongo, Dem. Rep.Congo, Rep.Costa RicaCote d'IvoireCroatiaCubaCyprusCzech RepublicDenmarkDjiboutiDominicaDominican RepublicEarly-demographic dividendEast Asia & PacificEast Asia & Pacific (excluding high income)East Asia & Pacific (IDA & IBRD countries)EcuadorEgypt, Arab Rep.El SalvadorEquatorial GuineaEritreaEstoniaEthiopiaEuro areaEurope & Central AsiaEurope & Central Asia (excluding high income)Europe & Central Asia (IDA & IBRD countries)European UnionFaroe IslandsFijiFinlandFragile and conflict affected situationsFranceFrench PolynesiaGabonGambia, TheGeorgiaGermanyGhanaGreeceGreenlandGrenadaGuatemalaGuineaGuinea-BissauGuyanaHaitiHeavily indebted poor countries (HIPC)High incomeHondurasHong Kong SAR, ChinaHungaryIBRD onlyIcelandIDA & IBRD totalIDA blendIDA onlyIDA totalIndiaIndonesiaIran, Islamic Rep.IraqIrelandIsraelItalyJamaicaJapanJordanKazakhstanKenyaKiribatiKorea, Rep.KuwaitKyrgyz RepublicLao PDRLate-demographic dividendLatin America & Caribbean Latin America & Caribbean (excluding high income)Latin America & the Caribbean (IDA & IBRD countries)LatviaLeast developed countries: UN classificationLebanonLesothoLiberiaLibyaLiechtensteinLithuaniaLow & middle incomeLow incomeLower middle incomeLuxembourgMacao SAR, ChinaMacedonia, FYRMadagascarMalawiMalaysiaMaldivesMaliMaltaMarshall IslandsMauritaniaMauritiusMexicoMicronesia, Fed. Sts.Middle East & North AfricaMiddle East & North Africa (excluding high income)Middle East & North Africa (IDA & IBRD countries)Middle incomeMoldovaMongoliaMontenegroMoroccoMozambiqueNamibiaNepalNetherlandsNew CaledoniaNew ZealandNicaraguaNigerNigeriaNorth AmericaNorwayOECD membersOmanOther small statesPacific island small statesPakistanPalauPanamaPapua New GuineaParaguayPeruPhilippinesPolandPortugalPost-demographic dividendPre-demographic dividendQatarRomaniaRussian FederationRwandaSamoaSao Tome and PrincipeSaudi ArabiaSenegalSerbiaSeychellesSierra LeoneSingaporeSlovak RepublicSloveniaSmall statesSolomon IslandsSouth AfricaSouth AsiaSouth Asia (IDA & IBRD)SpainSri LankaSt. Kitts and NevisSt. LuciaSt. Vincent and the GrenadinesSub-Saharan Africa Sub-Saharan Africa (excluding high income)Sub-Saharan Africa (IDA & IBRD countries)SudanSurinameSwazilandSwedenSwitzerlandSyrian Arab RepublicTajikistanTanzaniaThailandTimor-LesteTogoTongaTrinidad and TobagoTunisiaTurkeyTurkmenistanUgandaUkraineUnited Arab EmiratesUnited KingdomUnited StatesUpper middle incomeUruguayUzbekistanVanuatuVenezuela, RBVietnamWest Bank and GazaWorldYemen, Rep.ZambiaZimbabwe Linha do tempo:
Nesta escala de tempo está apresentado um gráfico de 1971 ano até 2014 ano Iran, Islamic Rep.. Dados de 1970 ano ausente. O número de observações reais por data: 42.
Fonte (nome):
Indicadores de desenvolvimento mundial
Fonte (organização):
World Bank staff estimates based on Samuel Fankhauser's "Valuing Climate Change: The Economics of the Greenhouse" (1995).
Categorias:
Economy & Growth, Environment
Foi atualizado:
23 abr 2017 ano
Indicadores de alterações dos valores ao longo dos anos
Mínimo:
0.286
1 jan 1987 ano
Máximo:
2.319
1 jan 2001 ano
Na data de observação
Valor
Mudança absoluta
A alteração em relação ao valor anterior
1 jan 1971 ano
1.13
+1.13
0.0%
1 jan 1972 ano
1.062
-0.067
-5.97%
1 jan 1973 ano
0.924
-0.138
-13.0%
1 jan 1974 ano
0.761
-0.164
-17.72%
1 jan 1975 ano
0.533
-0.228
-29.95%
1 jan 1976 ano
0.517
-0.016
-2.99%
1 jan 1977 ano
0.476
-0.041
-7.87%
1 jan 1978 ano
0.458
-0.018
-3.73%
1 jan 1979 ano
0.517
+0.059
12.79%
1 jan 1980 ano
0.463
-0.054
-10.47%
1 jan 1981 ano
0.362
-0.101
-21.78%
1 jan 1982 ano
0.347
-0.015
-4.24%
1 jan 1983 ano
0.365
+0.019
5.4%
1 jan 1984 ano
0.344
-0.021
-5.74%
1 jan 1985 ano
0.349
+0.005
1.4%
1 jan 1986 ano
0.35
+0.0
0.14%
1 jan 1987 ano
0.286
-0.064
-18.26%
1 jan 1988 ano
0.496
+0.21
73.53%
1 jan 1989 ano
0.629
+0.133
26.88%
1 jan 1990 ano
0.732
+0.102
16.26%
1 jan 1991 ano
0.833
+0.101
13.83%
1 jan 1994 ano
2.057
+1.224
146.88%
1 jan 1995 ano
2.134
+0.078
3.77%
1 jan 1996 ano
1.659
-0.475
-22.25%
1 jan 1997 ano
1.42
-0.24
-14.44%
1 jan 1998 ano
1.489
+0.07
4.9%
1 jan 1999 ano
1.784
+0.295
19.81%
1 jan 2000 ano
2.231
+0.446
25.01%
1 jan 2001 ano
2.319
+0.088
3.95%
1 jan 2002 ano
2.215
-0.104
-4.48%
1 jan 2003 ano
2.257
+0.043
1.93%
1 jan 2004 ano
2.034
-0.223
-9.88%
1 jan 2005 ano
1.895
-0.139
-6.84%
1 jan 2006 ano
1.734
-0.162
-8.53%
1 jan 2007 ano
1.664
-0.07
-4.04%
1 jan 2008 ano
1.349
-0.315
-18.92%
1 jan 2009 ano
1.237
-0.112
-8.28%
1 jan 2010 ano
1.283
+0.046
3.72%
1 jan 2011 ano
1.148
-0.135
-10.52%
1 jan 2012 ano
0.96
-0.188
-16.37%
1 jan 2013 ano
0.928
-0.033
-3.4%
1 jan 2014 ano
1.071
+0.144
15.51%
Classificação de países por estatísticas atuais por anos


Comentários: