29
/pt/
pt
AIzaSyAYiBZKx7MnpbEhh9jyipgxe19OcubqV5w
April 1, 2024
181798
Luxembourg
LUX
true
2
1
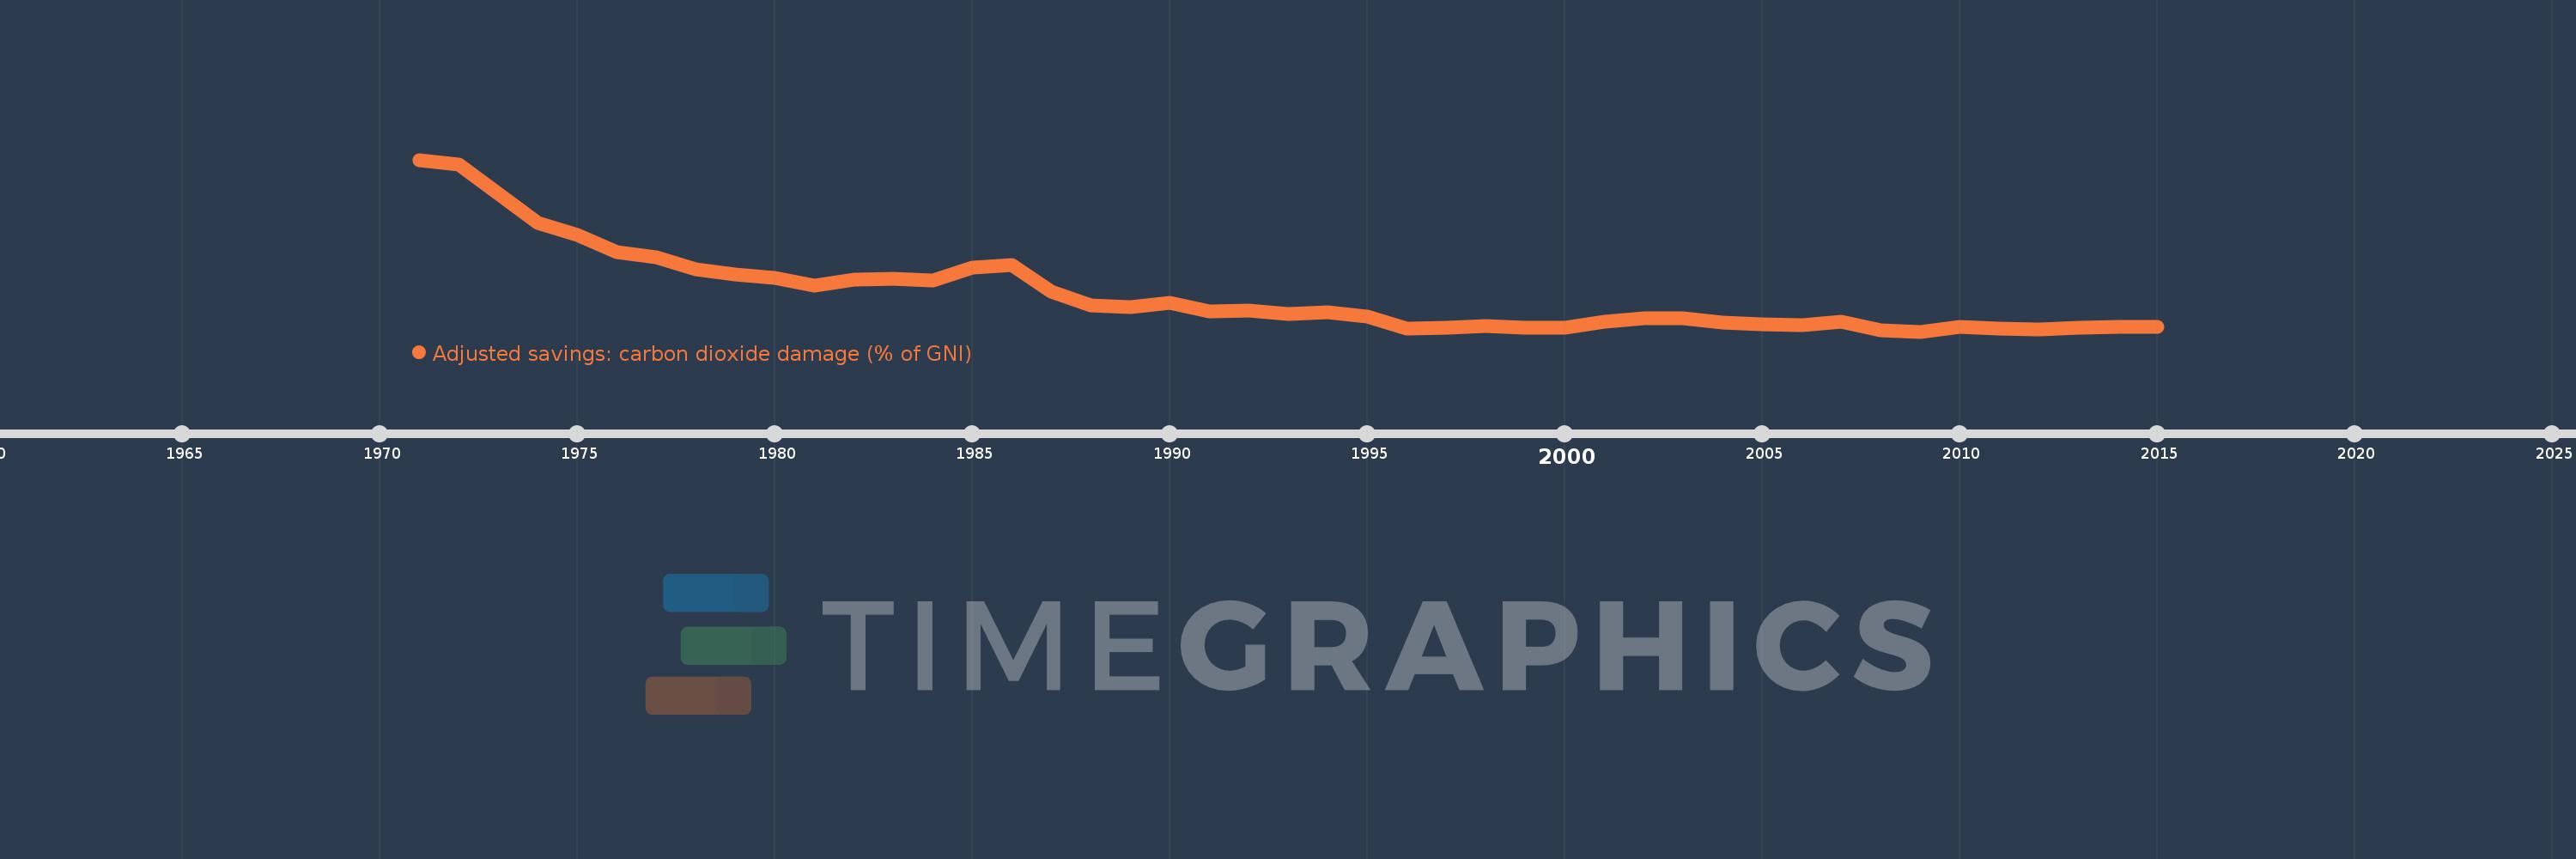
Adjusted savings: carbon dioxide damage (% of GNI)
2015,2014,2013,2012,2011,2010,2009,2008,2007,2006,2005,2004,2003,2002,2001,2000,1999,1998,1997,1996,1995,1994,1993,1992,1991,1990,1989,1988,1987,1986,1985,1984,1983,1982,1981,1980,1979,1978,1977,1976,1975,1974,1973,1972,1971
Estas estatísticas em outros países:
AfghanistanAlbaniaAlgeriaAndorraAngolaAntigua and BarbudaArab WorldArgentinaArmeniaAustraliaAustriaAzerbaijanBahamas, TheBahrainBangladeshBarbadosBelarusBelgiumBelizeBeninBermudaBhutanBoliviaBosnia and HerzegovinaBotswanaBrazilBrunei DarussalamBulgariaBurkina FasoBurundiCabo VerdeCambodiaCameroonCanadaCaribbean small statesCentral African RepublicCentral Europe and the BalticsChadChileChinaColombiaComorosCongo, Dem. Rep.Congo, Rep.Costa RicaCote d'IvoireCroatiaCubaCyprusCzech RepublicDenmarkDjiboutiDominicaDominican RepublicEarly-demographic dividendEast Asia & PacificEast Asia & Pacific (excluding high income)East Asia & Pacific (IDA & IBRD countries)EcuadorEgypt, Arab Rep.El SalvadorEquatorial GuineaEritreaEstoniaEthiopiaEuro areaEurope & Central AsiaEurope & Central Asia (excluding high income)Europe & Central Asia (IDA & IBRD countries)European UnionFaroe IslandsFijiFinlandFragile and conflict affected situationsFranceFrench PolynesiaGabonGambia, TheGeorgiaGermanyGhanaGreeceGreenlandGrenadaGuatemalaGuineaGuinea-BissauGuyanaHaitiHeavily indebted poor countries (HIPC)High incomeHondurasHong Kong SAR, ChinaHungaryIBRD onlyIcelandIDA & IBRD totalIDA blendIDA onlyIDA totalIndiaIndonesiaIran, Islamic Rep.IraqIrelandIsraelItalyJamaicaJapanJordanKazakhstanKenyaKiribatiKorea, Rep.KuwaitKyrgyz RepublicLao PDRLate-demographic dividendLatin America & Caribbean Latin America & Caribbean (excluding high income)Latin America & the Caribbean (IDA & IBRD countries)LatviaLeast developed countries: UN classificationLebanonLesothoLiberiaLibyaLiechtensteinLithuaniaLow & middle incomeLow incomeLower middle incomeLuxembourgMacao SAR, ChinaMacedonia, FYRMadagascarMalawiMalaysiaMaldivesMaliMaltaMarshall IslandsMauritaniaMauritiusMexicoMicronesia, Fed. Sts.Middle East & North AfricaMiddle East & North Africa (excluding high income)Middle East & North Africa (IDA & IBRD countries)Middle incomeMoldovaMongoliaMontenegroMoroccoMozambiqueNamibiaNepalNetherlandsNew CaledoniaNew ZealandNicaraguaNigerNigeriaNorth AmericaNorwayOECD membersOmanOther small statesPacific island small statesPakistanPalauPanamaPapua New GuineaParaguayPeruPhilippinesPolandPortugalPost-demographic dividendPre-demographic dividendQatarRomaniaRussian FederationRwandaSamoaSao Tome and PrincipeSaudi ArabiaSenegalSerbiaSeychellesSierra LeoneSingaporeSlovak RepublicSloveniaSmall statesSolomon IslandsSouth AfricaSouth AsiaSouth Asia (IDA & IBRD)SpainSri LankaSt. Kitts and NevisSt. LuciaSt. Vincent and the GrenadinesSub-Saharan Africa Sub-Saharan Africa (excluding high income)Sub-Saharan Africa (IDA & IBRD countries)SudanSurinameSwazilandSwedenSwitzerlandSyrian Arab RepublicTajikistanTanzaniaThailandTimor-LesteTogoTongaTrinidad and TobagoTunisiaTurkeyTurkmenistanUgandaUkraineUnited Arab EmiratesUnited KingdomUnited StatesUpper middle incomeUruguayUzbekistanVanuatuVenezuela, RBVietnamWest Bank and GazaWorldYemen, Rep.ZambiaZimbabwe Linha do tempo:
Nesta escala de tempo está apresentado um gráfico de 1971 ano até 2015 ano Luxembourg. Dados de 1970 ano ausente. O número de observações reais por data: 45.
Fonte (nome):
Indicadores de desenvolvimento mundial
Fonte (organização):
World Bank staff estimates based on Samuel Fankhauser's "Valuing Climate Change: The Economics of the Greenhouse" (1995).
Categorias:
Economy & Growth, Environment
Foi atualizado:
23 abr 2017 ano
Indicadores de alterações dos valores ao longo dos anos
Mínimo:
0.239
1 jan 2009 ano
Máximo:
1.83
1 jan 1971 ano
Na data de observação
Valor
Mudança absoluta
A alteração em relação ao valor anterior
1 jan 1971 ano
1.83
+1.83
0.0%
1 jan 1972 ano
1.785
-0.045
-2.45%
1 jan 1973 ano
1.517
-0.268
-15.02%
1 jan 1974 ano
1.248
-0.269
-17.7%
1 jan 1975 ano
1.131
-0.117
-9.39%
1 jan 1976 ano
0.977
-0.154
-13.59%
1 jan 1977 ano
0.927
-0.051
-5.18%
1 jan 1978 ano
0.815
-0.112
-12.11%
1 jan 1979 ano
0.768
-0.047
-5.73%
1 jan 1980 ano
0.736
-0.032
-4.15%
1 jan 1981 ano
0.665
-0.071
-9.64%
1 jan 1982 ano
0.721
+0.056
8.4%
1 jan 1983 ano
0.729
+0.008
1.18%
1 jan 1984 ano
0.713
-0.017
-2.32%
1 jan 1985 ano
0.829
+0.117
16.42%
1 jan 1986 ano
0.856
+0.026
3.16%
1 jan 1987 ano
0.609
-0.246
-28.79%
1 jan 1988 ano
0.483
-0.126
-20.69%
1 jan 1989 ano
0.469
-0.014
-2.86%
1 jan 1990 ano
0.506
+0.037
7.78%
1 jan 1991 ano
0.425
-0.081
-15.97%
1 jan 1992 ano
0.433
+0.007
1.72%
1 jan 1993 ano
0.399
-0.033
-7.65%
1 jan 1994 ano
0.419
+0.02
4.98%
1 jan 1995 ano
0.382
-0.037
-8.85%
1 jan 1996 ano
0.265
-0.117
-30.61%
1 jan 1997 ano
0.277
+0.012
4.45%
1 jan 1998 ano
0.288
+0.011
4.1%
1 jan 1999 ano
0.274
-0.015
-5.15%
1 jan 2000 ano
0.275
+0.001
0.38%
1 jan 2001 ano
0.328
+0.054
19.57%
1 jan 2002 ano
0.359
+0.031
9.49%
1 jan 2003 ano
0.364
+0.004
1.22%
1 jan 2004 ano
0.326
-0.037
-10.3%
1 jan 2005 ano
0.31
-0.016
-4.88%
1 jan 2006 ano
0.302
-0.008
-2.59%
1 jan 2007 ano
0.33
+0.028
9.29%
1 jan 2008 ano
0.254
-0.076
-23.03%
1 jan 2009 ano
0.239
-0.015
-5.86%
1 jan 2010 ano
0.281
+0.041
17.32%
1 jan 2011 ano
0.265
-0.016
-5.79%
1 jan 2012 ano
0.257
-0.008
-2.92%
1 jan 2013 ano
0.275
+0.018
7.03%
1 jan 2014 ano
0.283
+0.008
2.86%
1 jan 2015 ano
0.283
+0.0
0.05%
Classificação de países por estatísticas atuais por anos


Comentários: