29
/pt/
pt
AIzaSyAYiBZKx7MnpbEhh9jyipgxe19OcubqV5w
April 1, 2024
195123
Mexico
MEX
true
2
1
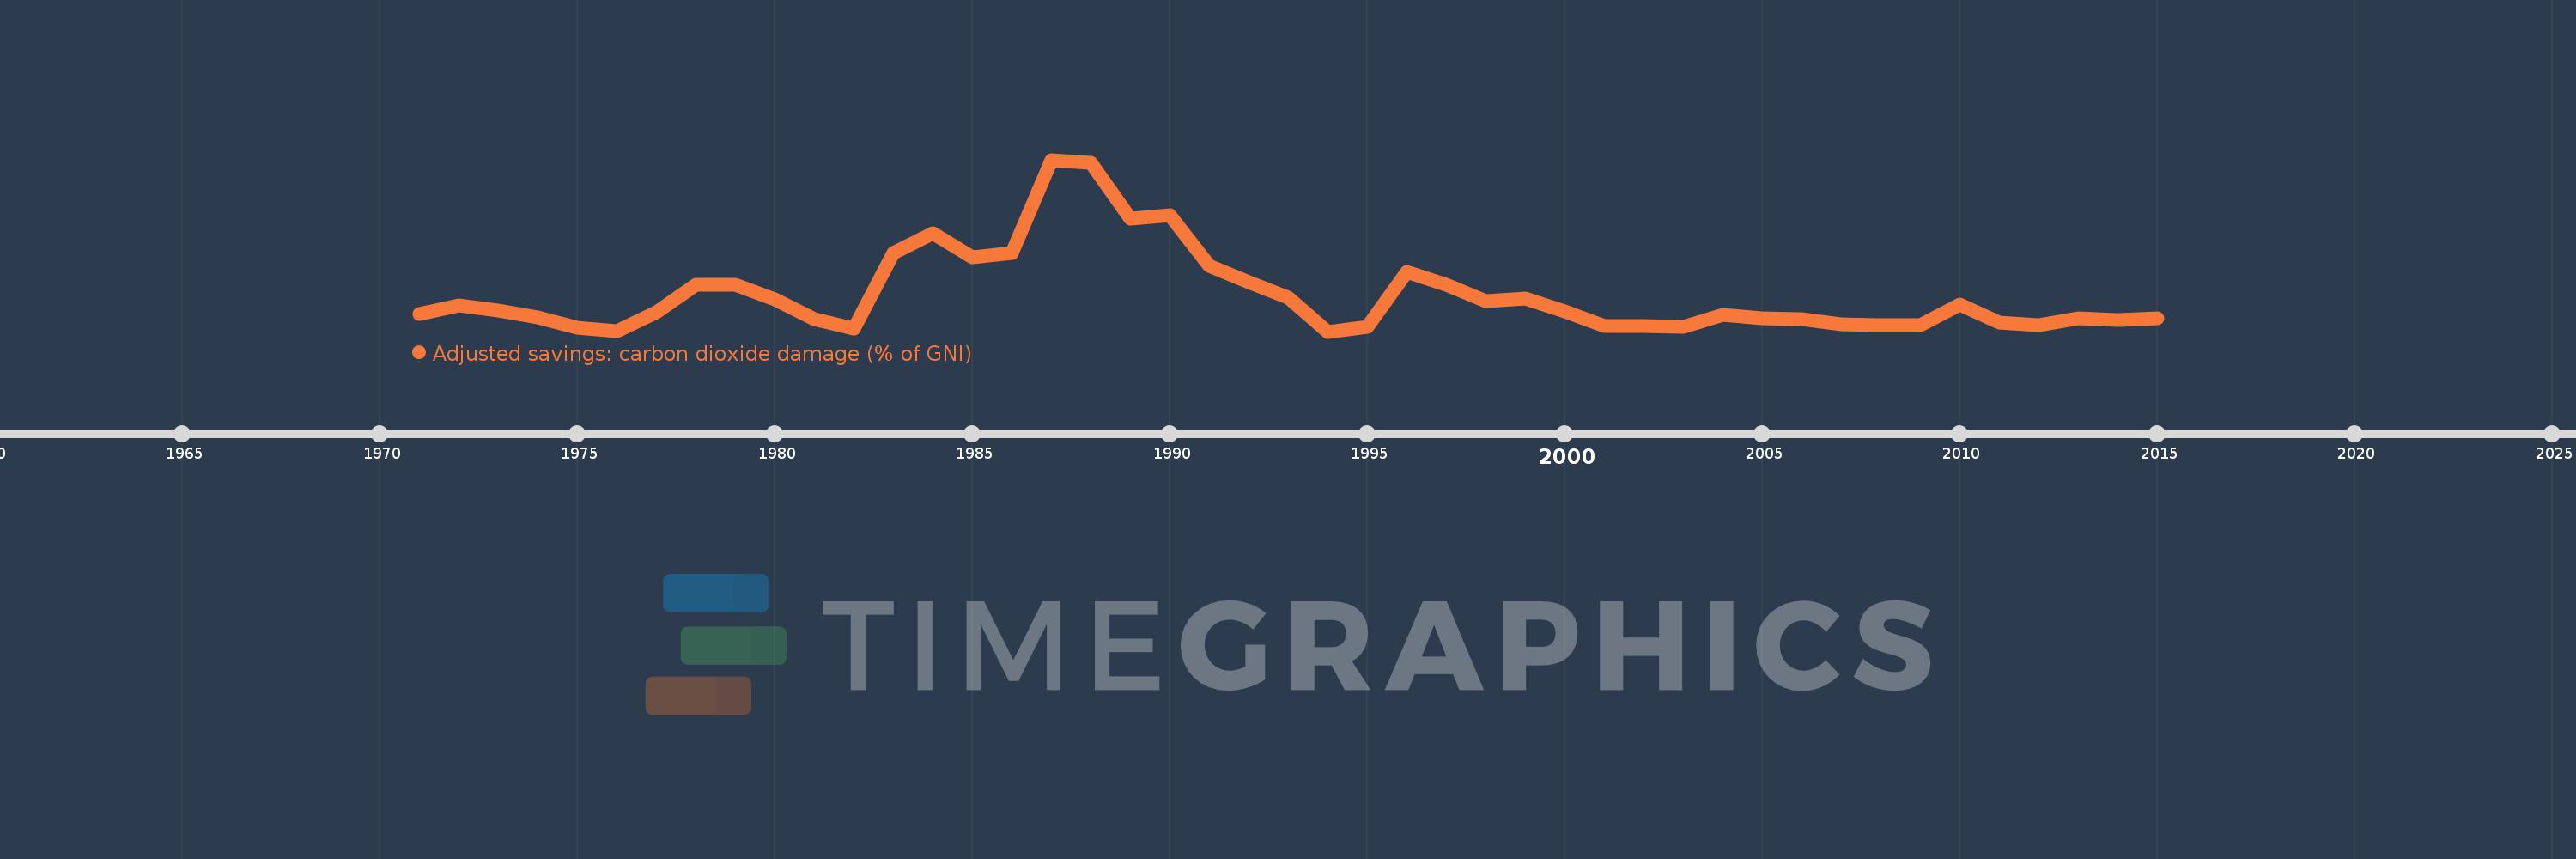
Adjusted savings: carbon dioxide damage (% of GNI)
2015,2014,2013,2012,2011,2010,2009,2008,2007,2006,2005,2004,2003,2002,2001,2000,1999,1998,1997,1996,1995,1994,1993,1992,1991,1990,1989,1988,1987,1986,1985,1984,1983,1982,1981,1980,1979,1978,1977,1976,1975,1974,1973,1972,1971
Estas estatísticas em outros países:
AfghanistanAlbaniaAlgeriaAndorraAngolaAntigua and BarbudaArab WorldArgentinaArmeniaAustraliaAustriaAzerbaijanBahamas, TheBahrainBangladeshBarbadosBelarusBelgiumBelizeBeninBermudaBhutanBoliviaBosnia and HerzegovinaBotswanaBrazilBrunei DarussalamBulgariaBurkina FasoBurundiCabo VerdeCambodiaCameroonCanadaCaribbean small statesCentral African RepublicCentral Europe and the BalticsChadChileChinaColombiaComorosCongo, Dem. Rep.Congo, Rep.Costa RicaCote d'IvoireCroatiaCubaCyprusCzech RepublicDenmarkDjiboutiDominicaDominican RepublicEarly-demographic dividendEast Asia & PacificEast Asia & Pacific (excluding high income)East Asia & Pacific (IDA & IBRD countries)EcuadorEgypt, Arab Rep.El SalvadorEquatorial GuineaEritreaEstoniaEthiopiaEuro areaEurope & Central AsiaEurope & Central Asia (excluding high income)Europe & Central Asia (IDA & IBRD countries)European UnionFaroe IslandsFijiFinlandFragile and conflict affected situationsFranceFrench PolynesiaGabonGambia, TheGeorgiaGermanyGhanaGreeceGreenlandGrenadaGuatemalaGuineaGuinea-BissauGuyanaHaitiHeavily indebted poor countries (HIPC)High incomeHondurasHong Kong SAR, ChinaHungaryIBRD onlyIcelandIDA & IBRD totalIDA blendIDA onlyIDA totalIndiaIndonesiaIran, Islamic Rep.IraqIrelandIsraelItalyJamaicaJapanJordanKazakhstanKenyaKiribatiKorea, Rep.KuwaitKyrgyz RepublicLao PDRLate-demographic dividendLatin America & Caribbean Latin America & Caribbean (excluding high income)Latin America & the Caribbean (IDA & IBRD countries)LatviaLeast developed countries: UN classificationLebanonLesothoLiberiaLibyaLiechtensteinLithuaniaLow & middle incomeLow incomeLower middle incomeLuxembourgMacao SAR, ChinaMacedonia, FYRMadagascarMalawiMalaysiaMaldivesMaliMaltaMarshall IslandsMauritaniaMauritiusMexicoMicronesia, Fed. Sts.Middle East & North AfricaMiddle East & North Africa (excluding high income)Middle East & North Africa (IDA & IBRD countries)Middle incomeMoldovaMongoliaMontenegroMoroccoMozambiqueNamibiaNepalNetherlandsNew CaledoniaNew ZealandNicaraguaNigerNigeriaNorth AmericaNorwayOECD membersOmanOther small statesPacific island small statesPakistanPalauPanamaPapua New GuineaParaguayPeruPhilippinesPolandPortugalPost-demographic dividendPre-demographic dividendQatarRomaniaRussian FederationRwandaSamoaSao Tome and PrincipeSaudi ArabiaSenegalSerbiaSeychellesSierra LeoneSingaporeSlovak RepublicSloveniaSmall statesSolomon IslandsSouth AfricaSouth AsiaSouth Asia (IDA & IBRD)SpainSri LankaSt. Kitts and NevisSt. LuciaSt. Vincent and the GrenadinesSub-Saharan Africa Sub-Saharan Africa (excluding high income)Sub-Saharan Africa (IDA & IBRD countries)SudanSurinameSwazilandSwedenSwitzerlandSyrian Arab RepublicTajikistanTanzaniaThailandTimor-LesteTogoTongaTrinidad and TobagoTunisiaTurkeyTurkmenistanUgandaUkraineUnited Arab EmiratesUnited KingdomUnited StatesUpper middle incomeUruguayUzbekistanVanuatuVenezuela, RBVietnamWest Bank and GazaWorldYemen, Rep.ZambiaZimbabwe Linha do tempo:
Nesta escala de tempo está apresentado um gráfico de 1971 ano até 2015 ano Mexico. Dados de 1970 ano ausente. O número de observações reais por data: 45.
Fonte (nome):
Indicadores de desenvolvimento mundial
Fonte (organização):
World Bank staff estimates based on Samuel Fankhauser's "Valuing Climate Change: The Economics of the Greenhouse" (1995).
Categorias:
Economy & Growth, Environment
Foi atualizado:
23 abr 2017 ano
Indicadores de alterações dos valores ao longo dos anos
Mínimo:
0.371
1 jan 1994 ano
Máximo:
0.996
1 jan 1987 ano
Na data de observação
Valor
Mudança absoluta
A alteração em relação ao valor anterior
1 jan 1971 ano
0.436
+0.436
0.0%
1 jan 1972 ano
0.466
+0.03
6.8%
1 jan 1973 ano
0.447
-0.018
-3.97%
1 jan 1974 ano
0.424
-0.024
-5.27%
1 jan 1975 ano
0.386
-0.037
-8.84%
1 jan 1976 ano
0.372
-0.014
-3.65%
1 jan 1977 ano
0.441
+0.069
18.56%
1 jan 1978 ano
0.541
+0.1
22.67%
1 jan 1979 ano
0.541
0.0
-0.08%
1 jan 1980 ano
0.489
-0.052
-9.55%
1 jan 1981 ano
0.417
-0.072
-14.65%
1 jan 1982 ano
0.383
-0.034
-8.19%
1 jan 1983 ano
0.656
+0.272
71.1%
1 jan 1984 ano
0.728
+0.072
10.99%
1 jan 1985 ano
0.642
-0.086
-11.83%
1 jan 1986 ano
0.657
+0.015
2.37%
1 jan 1987 ano
0.996
+0.339
51.68%
1 jan 1988 ano
0.985
-0.011
-1.1%
1 jan 1989 ano
0.782
-0.203
-20.62%
1 jan 1990 ano
0.794
+0.012
1.5%
1 jan 1991 ano
0.611
-0.183
-23.01%
1 jan 1992 ano
0.551
-0.06
-9.81%
1 jan 1993 ano
0.496
-0.055
-9.96%
1 jan 1994 ano
0.371
-0.125
-25.15%
1 jan 1995 ano
0.387
+0.016
4.25%
1 jan 1996 ano
0.587
+0.2
51.57%
1 jan 1997 ano
0.542
-0.045
-7.64%
1 jan 1998 ano
0.481
-0.061
-11.3%
1 jan 1999 ano
0.49
+0.01
1.98%
1 jan 2000 ano
0.444
-0.046
-9.37%
1 jan 2001 ano
0.39
-0.055
-12.33%
1 jan 2002 ano
0.392
+0.003
0.67%
1 jan 2003 ano
0.389
-0.003
-0.77%
1 jan 2004 ano
0.433
+0.043
11.16%
1 jan 2005 ano
0.421
-0.012
-2.71%
1 jan 2006 ano
0.415
-0.006
-1.44%
1 jan 2007 ano
0.398
-0.017
-4.06%
1 jan 2008 ano
0.394
-0.004
-0.97%
1 jan 2009 ano
0.396
+0.002
0.43%
1 jan 2010 ano
0.471
+0.075
19.03%
1 jan 2011 ano
0.403
-0.068
-14.48%
1 jan 2012 ano
0.394
-0.009
-2.3%
1 jan 2013 ano
0.418
+0.024
6.07%
1 jan 2014 ano
0.413
-0.004
-1.03%
1 jan 2015 ano
0.419
+0.006
1.34%
Classificação de países por estatísticas atuais por anos


Comentários: