29
/pt/
pt
AIzaSyAYiBZKx7MnpbEhh9jyipgxe19OcubqV5w
April 1, 2024
266501
Trinidad and Tobago
TTO
true
2
1
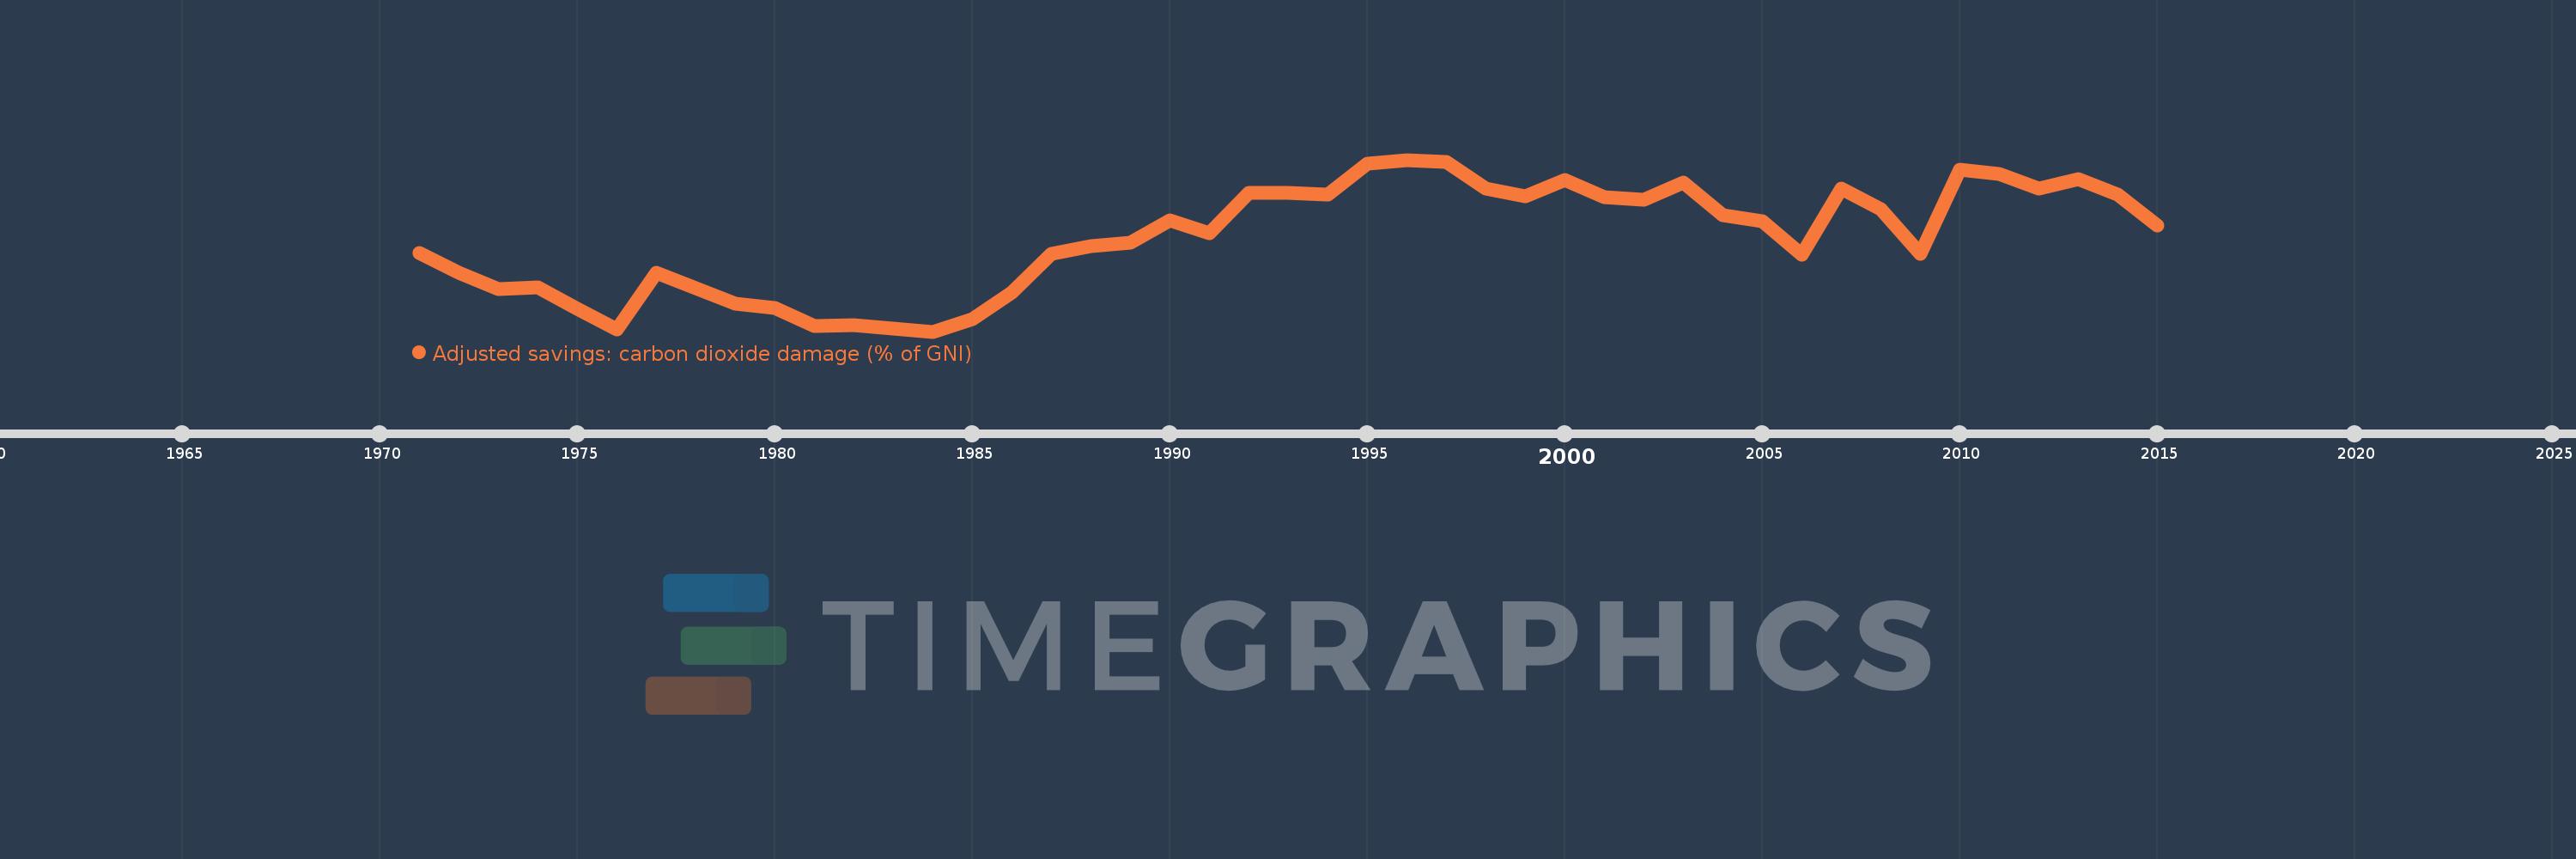
Adjusted savings: carbon dioxide damage (% of GNI)
2015,2014,2013,2012,2011,2010,2009,2008,2007,2006,2005,2004,2003,2002,2001,2000,1999,1998,1997,1996,1995,1994,1993,1992,1991,1990,1989,1988,1987,1986,1985,1984,1983,1982,1981,1980,1979,1978,1977,1976,1975,1974,1973,1972,1971
Estas estatísticas em outros países:
AfghanistanAlbaniaAlgeriaAndorraAngolaAntigua and BarbudaArab WorldArgentinaArmeniaAustraliaAustriaAzerbaijanBahamas, TheBahrainBangladeshBarbadosBelarusBelgiumBelizeBeninBermudaBhutanBoliviaBosnia and HerzegovinaBotswanaBrazilBrunei DarussalamBulgariaBurkina FasoBurundiCabo VerdeCambodiaCameroonCanadaCaribbean small statesCentral African RepublicCentral Europe and the BalticsChadChileChinaColombiaComorosCongo, Dem. Rep.Congo, Rep.Costa RicaCote d'IvoireCroatiaCubaCyprusCzech RepublicDenmarkDjiboutiDominicaDominican RepublicEarly-demographic dividendEast Asia & PacificEast Asia & Pacific (excluding high income)East Asia & Pacific (IDA & IBRD countries)EcuadorEgypt, Arab Rep.El SalvadorEquatorial GuineaEritreaEstoniaEthiopiaEuro areaEurope & Central AsiaEurope & Central Asia (excluding high income)Europe & Central Asia (IDA & IBRD countries)European UnionFaroe IslandsFijiFinlandFragile and conflict affected situationsFranceFrench PolynesiaGabonGambia, TheGeorgiaGermanyGhanaGreeceGreenlandGrenadaGuatemalaGuineaGuinea-BissauGuyanaHaitiHeavily indebted poor countries (HIPC)High incomeHondurasHong Kong SAR, ChinaHungaryIBRD onlyIcelandIDA & IBRD totalIDA blendIDA onlyIDA totalIndiaIndonesiaIran, Islamic Rep.IraqIrelandIsraelItalyJamaicaJapanJordanKazakhstanKenyaKiribatiKorea, Rep.KuwaitKyrgyz RepublicLao PDRLate-demographic dividendLatin America & Caribbean Latin America & Caribbean (excluding high income)Latin America & the Caribbean (IDA & IBRD countries)LatviaLeast developed countries: UN classificationLebanonLesothoLiberiaLibyaLiechtensteinLithuaniaLow & middle incomeLow incomeLower middle incomeLuxembourgMacao SAR, ChinaMacedonia, FYRMadagascarMalawiMalaysiaMaldivesMaliMaltaMarshall IslandsMauritaniaMauritiusMexicoMicronesia, Fed. Sts.Middle East & North AfricaMiddle East & North Africa (excluding high income)Middle East & North Africa (IDA & IBRD countries)Middle incomeMoldovaMongoliaMontenegroMoroccoMozambiqueNamibiaNepalNetherlandsNew CaledoniaNew ZealandNicaraguaNigerNigeriaNorth AmericaNorwayOECD membersOmanOther small statesPacific island small statesPakistanPalauPanamaPapua New GuineaParaguayPeruPhilippinesPolandPortugalPost-demographic dividendPre-demographic dividendQatarRomaniaRussian FederationRwandaSamoaSao Tome and PrincipeSaudi ArabiaSenegalSerbiaSeychellesSierra LeoneSingaporeSlovak RepublicSloveniaSmall statesSolomon IslandsSouth AfricaSouth AsiaSouth Asia (IDA & IBRD)SpainSri LankaSt. Kitts and NevisSt. LuciaSt. Vincent and the GrenadinesSub-Saharan Africa Sub-Saharan Africa (excluding high income)Sub-Saharan Africa (IDA & IBRD countries)SudanSurinameSwazilandSwedenSwitzerlandSyrian Arab RepublicTajikistanTanzaniaThailandTimor-LesteTogoTongaTrinidad and TobagoTunisiaTurkeyTurkmenistanUgandaUkraineUnited Arab EmiratesUnited KingdomUnited StatesUpper middle incomeUruguayUzbekistanVanuatuVenezuela, RBVietnamWest Bank and GazaWorldYemen, Rep.ZambiaZimbabwe Linha do tempo:
Nesta escala de tempo está apresentado um gráfico de 1971 ano até 2015 ano Trinidad and Tobago. Dados de 1970 ano ausente. O número de observações reais por data: 45.
Fonte (nome):
Indicadores de desenvolvimento mundial
Fonte (organização):
World Bank staff estimates based on Samuel Fankhauser's "Valuing Climate Change: The Economics of the Greenhouse" (1995).
Categorias:
Economy & Growth, Environment
Foi atualizado:
23 abr 2017 ano
Indicadores de alterações dos valores ao longo dos anos
Mínimo:
0.776
1 jan 1984 ano
Máximo:
2.548
1 jan 1996 ano
Na data de observação
Valor
Mudança absoluta
A alteração em relação ao valor anterior
1 jan 1971 ano
1.587
+1.587
0.0%
1 jan 1972 ano
1.386
-0.201
-12.69%
1 jan 1973 ano
1.219
-0.166
-12.01%
1 jan 1974 ano
1.234
+0.015
1.22%
1 jan 1975 ano
1.008
-0.226
-18.32%
1 jan 1976 ano
0.794
-0.214
-21.2%
1 jan 1977 ano
1.384
+0.59
74.24%
1 jan 1978 ano
1.227
-0.157
-11.37%
1 jan 1979 ano
1.064
-0.163
-13.27%
1 jan 1980 ano
1.019
-0.045
-4.22%
1 jan 1981 ano
0.836
-0.183
-17.97%
1 jan 1982 ano
0.839
+0.003
0.39%
1 jan 1983 ano
0.807
-0.032
-3.77%
1 jan 1984 ano
0.776
-0.032
-3.93%
1 jan 1985 ano
0.902
+0.127
16.31%
1 jan 1986 ano
1.18
+0.278
30.83%
1 jan 1987 ano
1.579
+0.398
33.76%
1 jan 1988 ano
1.659
+0.08
5.08%
1 jan 1989 ano
1.693
+0.034
2.07%
1 jan 1990 ano
1.926
+0.233
13.73%
1 jan 1991 ano
1.793
-0.133
-6.89%
1 jan 1992 ano
2.208
+0.415
23.15%
1 jan 1993 ano
2.205
-0.003
-0.16%
1 jan 1994 ano
2.187
-0.018
-0.83%
1 jan 1995 ano
2.505
+0.319
14.58%
1 jan 1996 ano
2.548
+0.042
1.69%
1 jan 1997 ano
2.529
-0.019
-0.74%
1 jan 1998 ano
2.249
-0.279
-11.05%
1 jan 1999 ano
2.171
-0.078
-3.48%
1 jan 2000 ano
2.343
+0.172
7.93%
1 jan 2001 ano
2.162
-0.181
-7.71%
1 jan 2002 ano
2.139
-0.024
-1.09%
1 jan 2003 ano
2.311
+0.172
8.06%
1 jan 2004 ano
1.975
-0.336
-14.54%
1 jan 2005 ano
1.917
-0.058
-2.96%
1 jan 2006 ano
1.571
-0.346
-18.03%
1 jan 2007 ano
2.248
+0.677
43.1%
1 jan 2008 ano
2.042
-0.206
-9.17%
1 jan 2009 ano
1.579
-0.462
-22.65%
1 jan 2010 ano
2.446
+0.867
54.88%
1 jan 2011 ano
2.398
-0.049
-1.99%
1 jan 2012 ano
2.252
-0.145
-6.07%
1 jan 2013 ano
2.346
+0.094
4.18%
1 jan 2014 ano
2.191
-0.156
-6.63%
1 jan 2015 ano
1.871
-0.32
-14.6%
Classificação de países por estatísticas atuais por anos


Comentários: