29
/pt/
pt
AIzaSyAYiBZKx7MnpbEhh9jyipgxe19OcubqV5w
April 1, 2024
55453
Pre-demographic dividend
PRE
false
2
1
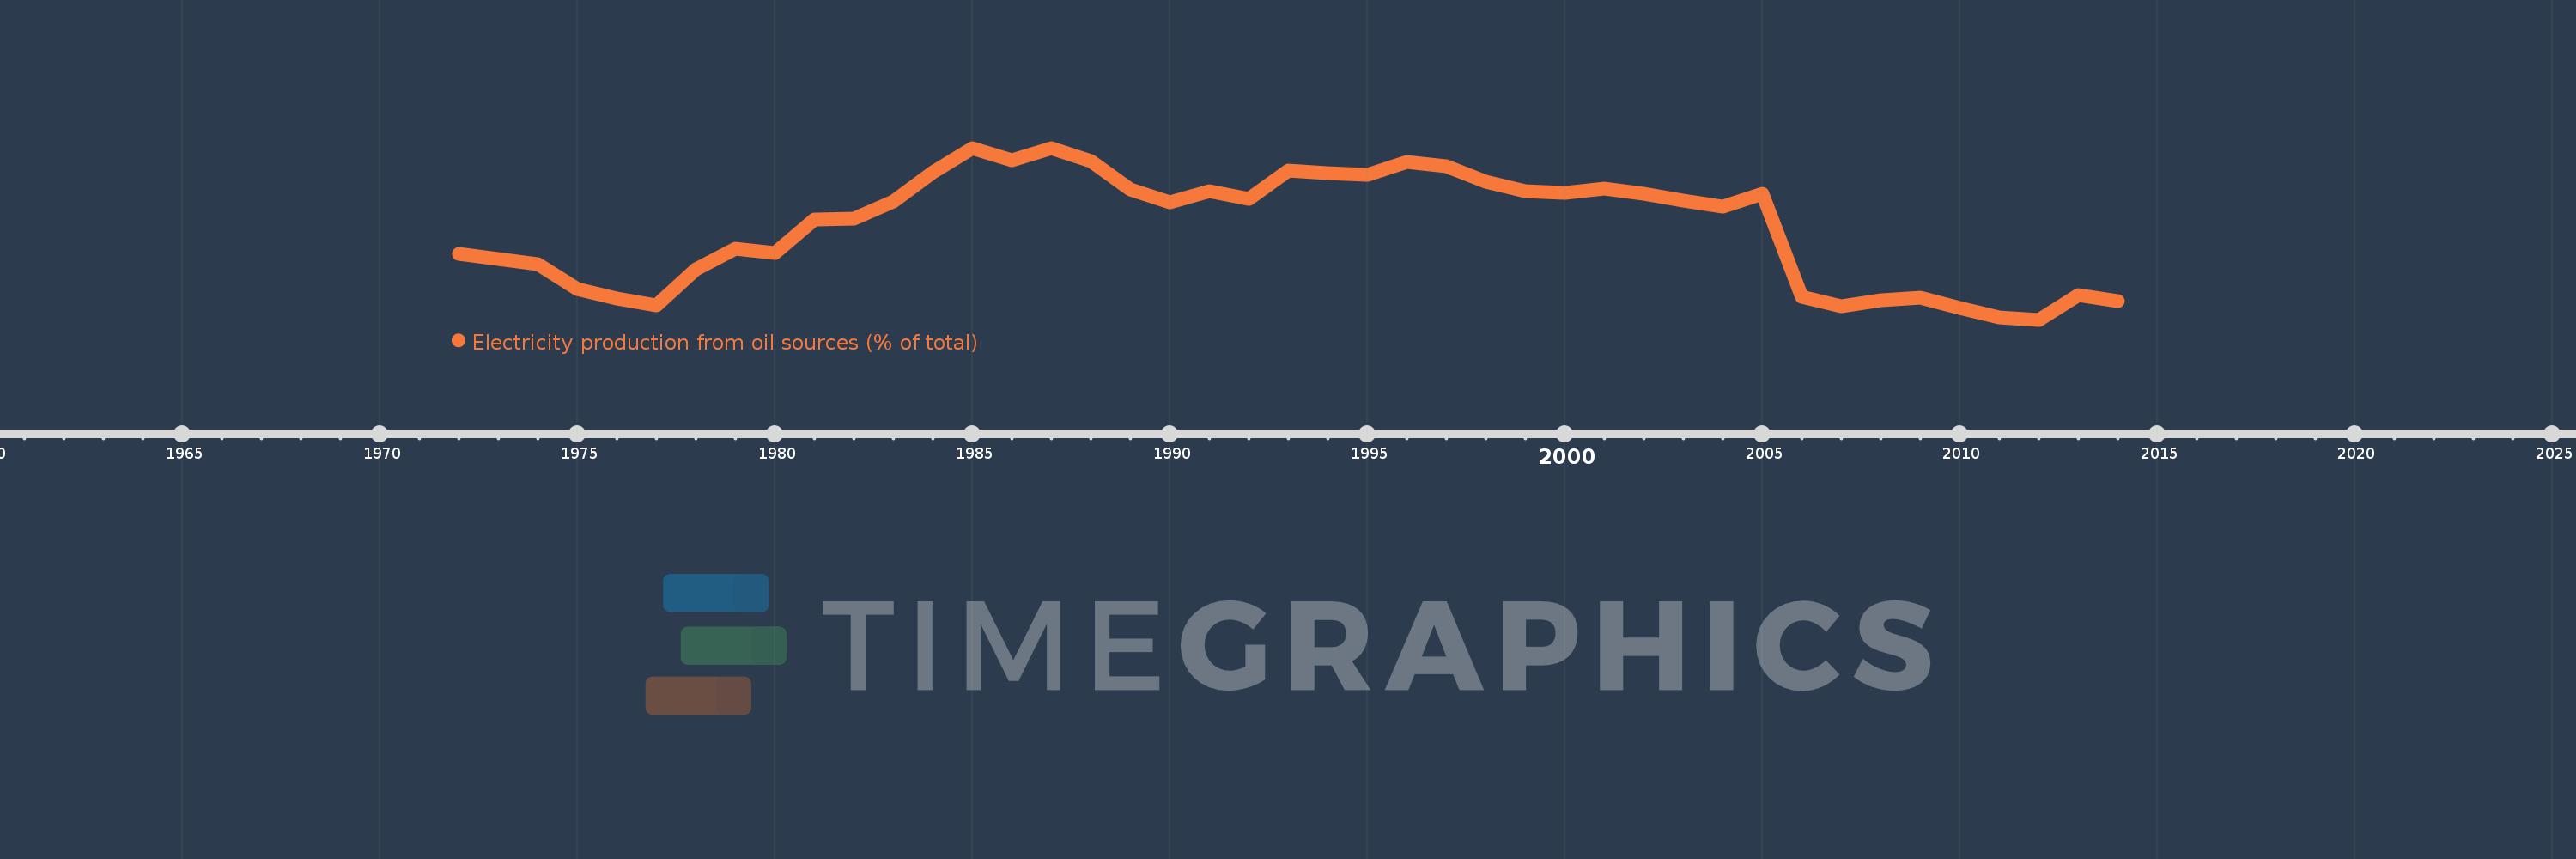
Electricity production from oil sources (% of total)
2014,2013,2012,2011,2010,2009,2008,2007,2006,2005,2004,2003,2002,2001,2000,1999,1998,1997,1996,1995,1994,1993,1992,1991,1990,1989,1988,1987,1986,1985,1984,1983,1982,1981,1980,1979,1978,1977,1976,1975,1974,1973,1972
Estas estatísticas em outros países:
AlbaniaAlgeriaAngolaArab WorldArgentinaArmeniaAustraliaAustriaAzerbaijanBahrainBangladeshBelarusBelgiumBeninBoliviaBosnia and HerzegovinaBotswanaBrazilBrunei DarussalamBulgariaCambodiaCameroonCanadaCentral Europe and the BalticsChileChinaColombiaCongo, Dem. Rep.Congo, Rep.Costa RicaCote d'IvoireCroatiaCubaCuracaoCyprusCzech RepublicDenmarkDominican RepublicEarly-demographic dividendEast Asia & PacificEast Asia & Pacific (excluding high income)East Asia & Pacific (IDA & IBRD countries)EcuadorEgypt, Arab Rep.El SalvadorEritreaEstoniaEthiopiaEuro areaEurope & Central AsiaEurope & Central Asia (excluding high income)Europe & Central Asia (IDA & IBRD countries)European UnionFinlandFragile and conflict affected situationsFranceGabonGeorgiaGermanyGhanaGibraltarGreeceGuatemalaHaitiHeavily indebted poor countries (HIPC)High incomeHondurasHong Kong SAR, ChinaHungaryIBRD onlyIcelandIDA & IBRD totalIDA blendIDA onlyIDA totalIndiaIndonesiaIran, Islamic Rep.IraqIrelandIsraelItalyJamaicaJapanJordanKazakhstanKenyaKorea, Dem. People’s Rep.Korea, Rep.KosovoKuwaitKyrgyz RepublicLate-demographic dividendLatin America & Caribbean Latin America & Caribbean (excluding high income)Latin America & the Caribbean (IDA & IBRD countries)LatviaLeast developed countries: UN classificationLebanonLibyaLithuaniaLow & middle incomeLower middle incomeLuxembourgMacedonia, FYRMalaysiaMaltaMauritiusMexicoMiddle East & North AfricaMiddle East & North Africa (excluding high income)Middle East & North Africa (IDA & IBRD countries)Middle incomeMoldovaMongoliaMontenegroMoroccoMozambiqueMyanmarNamibiaNepalNetherlandsNew ZealandNicaraguaNigerNigeriaNorth AmericaNorwayOECD membersOmanOther small statesPakistanPanamaParaguayPeruPhilippinesPolandPortugalPost-demographic dividendPre-demographic dividendQatarRomaniaRussian FederationSaudi ArabiaSenegalSerbiaSingaporeSlovak RepublicSloveniaSmall statesSouth AfricaSouth AsiaSouth Asia (IDA & IBRD)South SudanSpainSri LankaSub-Saharan Africa Sub-Saharan Africa (excluding high income)Sub-Saharan Africa (IDA & IBRD countries)SudanSwedenSwitzerlandSyrian Arab RepublicTajikistanTanzaniaThailandTogoTrinidad and TobagoTunisiaTurkeyTurkmenistanUkraineUnited Arab EmiratesUnited KingdomUnited StatesUpper middle incomeUruguayUzbekistanVenezuela, RBVietnamWorldYemen, Rep.ZambiaZimbabwe Linha do tempo:
Nesta escala de tempo está apresentado um gráfico de 1972 ano até 2014 ano Pre-demographic dividend. Dados de 1971 ano ausente. O número de observações reais por data: 43.
Fonte (nome):
Indicadores de desenvolvimento mundial
Fonte (organização):
IEA Statistics © OECD/IEA 2014 (http://www.iea.org/stats/index.asp), subject to https://www.iea.org/t&c/termsandconditions/
Categorias:
Energy & Mining, Climate Change, Infrastructure
Foi atualizado:
23 abr 2017 ano
Indicadores de alterações dos valores ao longo dos anos
Mínimo:
9.733
1 jan 2012 ano
Máximo:
36.015
1 jan 1985 ano
Na data de observação
Valor
Mudança absoluta
A alteração em relação ao valor anterior
1 jan 1972 ano
19.825
+19.825
0.0%
1 jan 1973 ano
19.014
-0.81
-4.09%
1 jan 1974 ano
18.282
-0.733
-3.85%
1 jan 1975 ano
14.475
-3.806
-20.82%
1 jan 1976 ano
12.945
-1.531
-10.57%
1 jan 1977 ano
11.869
-1.076
-8.31%
1 jan 1978 ano
17.425
+5.556
46.81%
1 jan 1979 ano
20.642
+3.218
18.47%
1 jan 1980 ano
19.879
-0.763
-3.7%
1 jan 1981 ano
25.073
+5.194
26.13%
1 jan 1982 ano
25.143
+0.07
0.28%
1 jan 1983 ano
27.792
+2.649
10.53%
1 jan 1984 ano
32.34
+4.548
16.36%
1 jan 1985 ano
36.015
+3.676
11.37%
1 jan 1986 ano
34.193
-1.823
-5.06%
1 jan 1987 ano
36.001
+1.809
5.29%
1 jan 1988 ano
33.946
-2.056
-5.71%
1 jan 1989 ano
29.719
-4.227
-12.45%
1 jan 1990 ano
27.65
-2.069
-6.96%
1 jan 1991 ano
29.37
+1.72
6.22%
1 jan 1992 ano
28.228
-1.142
-3.89%
1 jan 1993 ano
32.531
+4.304
15.25%
1 jan 1994 ano
32.115
-0.417
-1.28%
1 jan 1995 ano
31.891
-0.224
-0.7%
1 jan 1996 ano
33.832
+1.941
6.09%
1 jan 1997 ano
33.21
-0.621
-1.84%
1 jan 1998 ano
30.806
-2.404
-7.24%
1 jan 1999 ano
29.439
-1.367
-4.44%
1 jan 2000 ano
29.174
-0.265
-0.9%
1 jan 2001 ano
29.796
+0.622
2.13%
1 jan 2002 ano
28.965
-0.831
-2.79%
1 jan 2003 ano
27.992
-0.973
-3.36%
1 jan 2004 ano
26.991
-1.001
-3.57%
1 jan 2005 ano
29.007
+2.015
7.47%
1 jan 2006 ano
13.23
-15.777
-54.39%
1 jan 2007 ano
11.797
-1.433
-10.83%
1 jan 2008 ano
12.684
+0.887
7.52%
1 jan 2009 ano
13.118
+0.433
3.42%
1 jan 2010 ano
11.55
-1.568
-11.95%
1 jan 2011 ano
10.047
-1.503
-13.01%
1 jan 2012 ano
9.733
-0.314
-3.13%
1 jan 2013 ano
13.558
+3.825
39.3%
1 jan 2014 ano
12.625
-0.933
-6.88%
Classificação de países por estatísticas atuais por anos


Comentários: