29
/pt/
pt
AIzaSyAYiBZKx7MnpbEhh9jyipgxe19OcubqV5w
April 1, 2024
158356
Iraq
IRQ
true
2
1
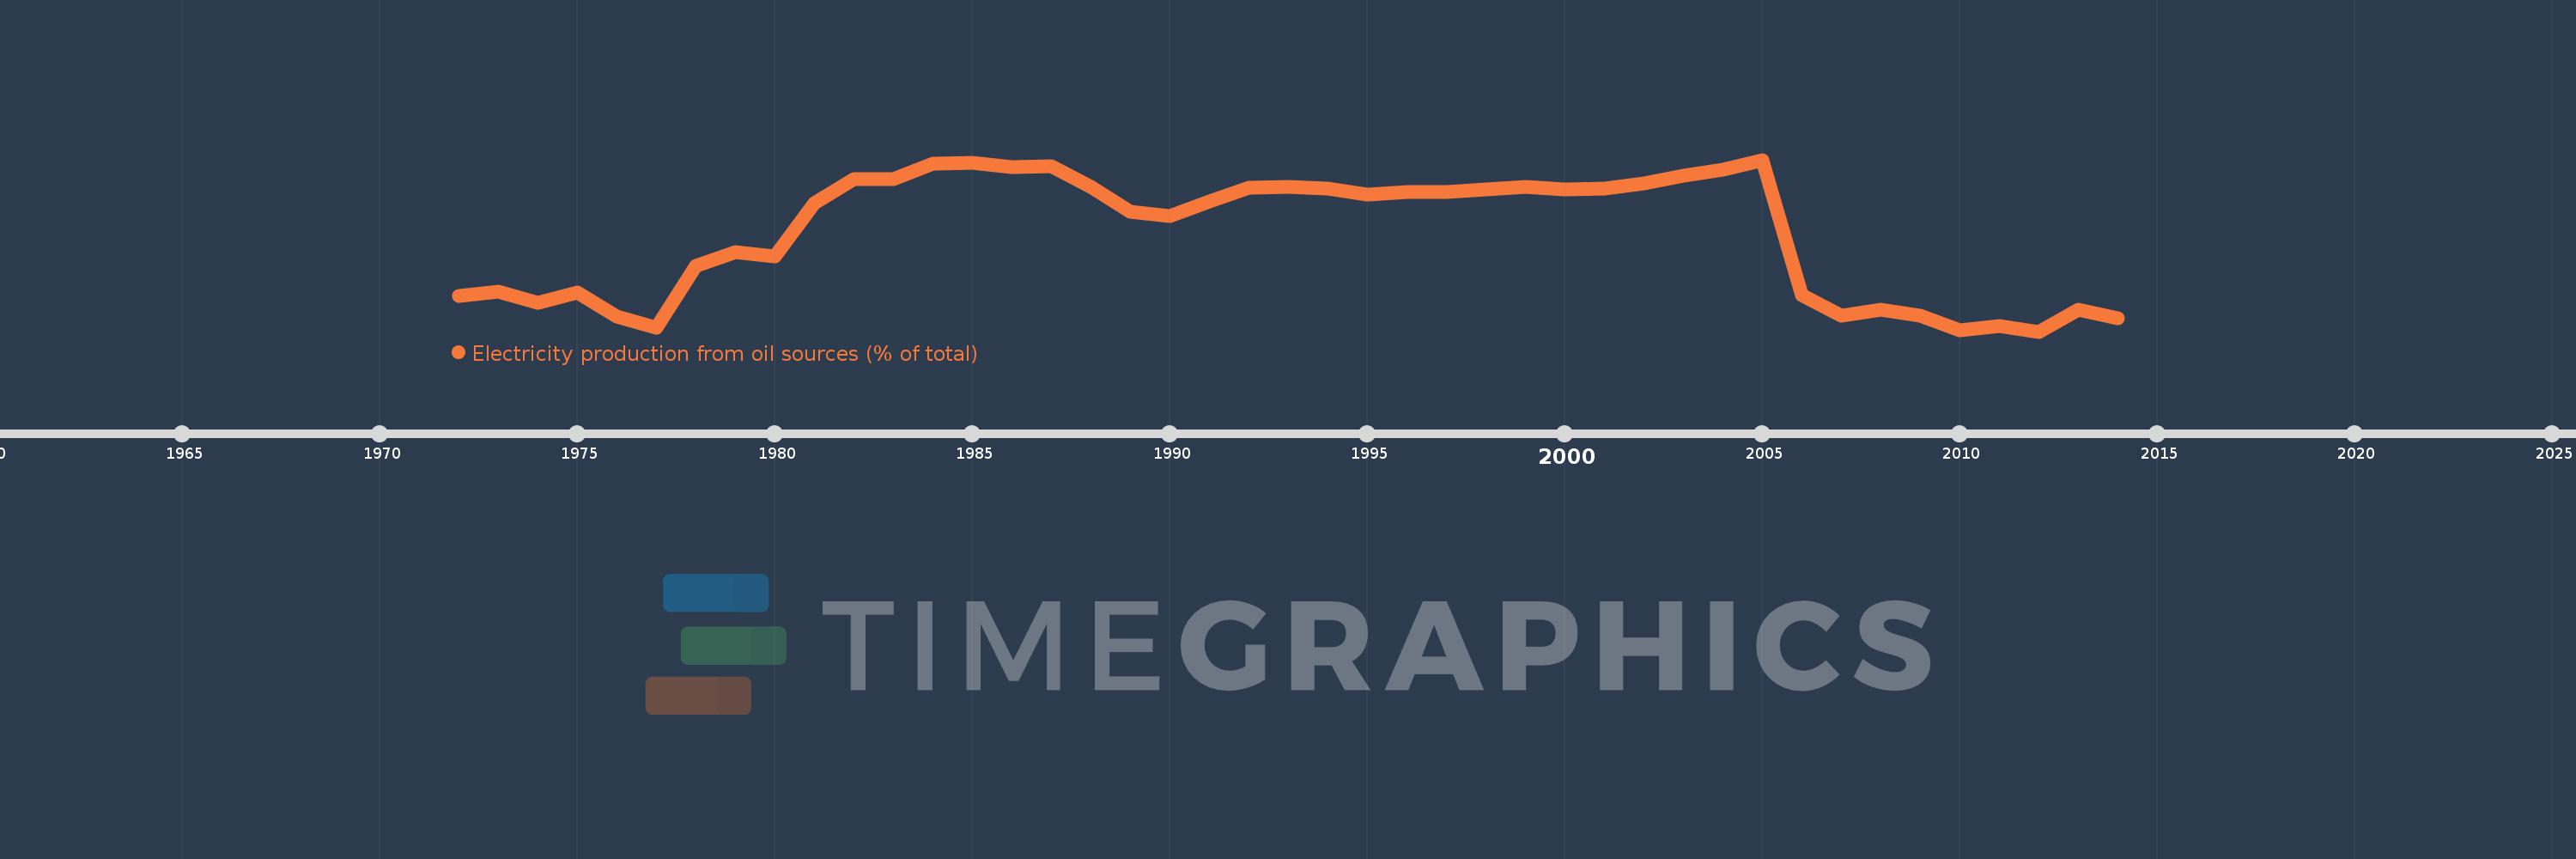
Electricity production from oil sources (% of total)
2014,2013,2012,2011,2010,2009,2008,2007,2006,2005,2004,2003,2002,2001,2000,1999,1998,1997,1996,1995,1994,1993,1992,1991,1990,1989,1988,1987,1986,1985,1984,1983,1982,1981,1980,1979,1978,1977,1976,1975,1974,1973,1972
Estas estatísticas em outros países:
AlbaniaAlgeriaAngolaArab WorldArgentinaArmeniaAustraliaAustriaAzerbaijanBahrainBangladeshBelarusBelgiumBeninBoliviaBosnia and HerzegovinaBotswanaBrazilBrunei DarussalamBulgariaCambodiaCameroonCanadaCentral Europe and the BalticsChileChinaColombiaCongo, Dem. Rep.Congo, Rep.Costa RicaCote d'IvoireCroatiaCubaCuracaoCyprusCzech RepublicDenmarkDominican RepublicEarly-demographic dividendEast Asia & PacificEast Asia & Pacific (excluding high income)East Asia & Pacific (IDA & IBRD countries)EcuadorEgypt, Arab Rep.El SalvadorEritreaEstoniaEthiopiaEuro areaEurope & Central AsiaEurope & Central Asia (excluding high income)Europe & Central Asia (IDA & IBRD countries)European UnionFinlandFragile and conflict affected situationsFranceGabonGeorgiaGermanyGhanaGibraltarGreeceGuatemalaHaitiHeavily indebted poor countries (HIPC)High incomeHondurasHong Kong SAR, ChinaHungaryIBRD onlyIcelandIDA & IBRD totalIDA blendIDA onlyIDA totalIndiaIndonesiaIran, Islamic Rep.IraqIrelandIsraelItalyJamaicaJapanJordanKazakhstanKenyaKorea, Dem. People’s Rep.Korea, Rep.KosovoKuwaitKyrgyz RepublicLate-demographic dividendLatin America & Caribbean Latin America & Caribbean (excluding high income)Latin America & the Caribbean (IDA & IBRD countries)LatviaLeast developed countries: UN classificationLebanonLibyaLithuaniaLow & middle incomeLower middle incomeLuxembourgMacedonia, FYRMalaysiaMaltaMauritiusMexicoMiddle East & North AfricaMiddle East & North Africa (excluding high income)Middle East & North Africa (IDA & IBRD countries)Middle incomeMoldovaMongoliaMontenegroMoroccoMozambiqueMyanmarNamibiaNepalNetherlandsNew ZealandNicaraguaNigerNigeriaNorth AmericaNorwayOECD membersOmanOther small statesPakistanPanamaParaguayPeruPhilippinesPolandPortugalPost-demographic dividendPre-demographic dividendQatarRomaniaRussian FederationSaudi ArabiaSenegalSerbiaSingaporeSlovak RepublicSloveniaSmall statesSouth AfricaSouth AsiaSouth Asia (IDA & IBRD)South SudanSpainSri LankaSub-Saharan Africa Sub-Saharan Africa (excluding high income)Sub-Saharan Africa (IDA & IBRD countries)SudanSwedenSwitzerlandSyrian Arab RepublicTajikistanTanzaniaThailandTogoTrinidad and TobagoTunisiaTurkeyTurkmenistanUkraineUnited Arab EmiratesUnited KingdomUnited StatesUpper middle incomeUruguayUzbekistanVenezuela, RBVietnamWorldYemen, Rep.ZambiaZimbabwe Linha do tempo:
Nesta escala de tempo está apresentado um gráfico de 1972 ano até 2014 ano Iraq. Dados de 1971 ano ausente. O número de observações reais por data: 43.
Fonte (nome):
Indicadores de desenvolvimento mundial
Fonte (organização):
IEA Statistics © OECD/IEA 2014 (http://www.iea.org/stats/index.asp), subject to https://www.iea.org/t&c/termsandconditions/
Categorias:
Energy & Mining, Climate Change, Infrastructure
Foi atualizado:
23 abr 2017 ano
Indicadores de alterações dos valores ao longo dos anos
Mínimo:
13.068
1 jan 2012 ano
Máximo:
92.59
1 jan 2005 ano
Na data de observação
Valor
Mudança absoluta
A alteração em relação ao valor anterior
1 jan 1972 ano
29.75
+29.75
0.0%
1 jan 1973 ano
31.517
+1.767
5.94%
1 jan 1974 ano
26.428
-5.089
-16.15%
1 jan 1975 ano
30.973
+4.545
17.2%
1 jan 1976 ano
19.964
-11.008
-35.54%
1 jan 1977 ano
14.717
-5.248
-26.29%
1 jan 1978 ano
43.338
+28.621
194.48%
1 jan 1979 ano
49.738
+6.401
14.77%
1 jan 1980 ano
48.037
-1.701
-3.42%
1 jan 1981 ano
72.556
+24.518
51.04%
1 jan 1982 ano
83.466
+10.91
15.04%
1 jan 1983 ano
83.79
+0.324
0.39%
1 jan 1984 ano
90.775
+6.986
8.34%
1 jan 1985 ano
91.104
+0.329
0.36%
1 jan 1986 ano
89.391
-1.713
-1.88%
1 jan 1987 ano
89.635
+0.244
0.27%
1 jan 1988 ano
80.009
-9.626
-10.74%
1 jan 1989 ano
68.657
-11.352
-14.19%
1 jan 1990 ano
66.408
-2.249
-3.27%
1 jan 1991 ano
73.492
+7.083
10.67%
1 jan 1992 ano
79.789
+6.297
8.57%
1 jan 1993 ano
80.186
+0.397
0.5%
1 jan 1994 ano
79.297
-0.889
-1.11%
1 jan 1995 ano
76.489
-2.807
-3.54%
1 jan 1996 ano
77.833
+1.344
1.76%
1 jan 1997 ano
77.611
-0.223
-0.29%
1 jan 1998 ano
78.984
+1.374
1.77%
1 jan 1999 ano
79.971
+0.987
1.25%
1 jan 2000 ano
78.941
-1.03
-1.29%
1 jan 2001 ano
79.323
+0.382
0.48%
1 jan 2002 ano
81.824
+2.501
3.15%
1 jan 2003 ano
85.232
+3.408
4.16%
1 jan 2004 ano
88.013
+2.782
3.26%
1 jan 2005 ano
92.59
+4.577
5.2%
1 jan 2006 ano
29.921
-62.669
-67.68%
1 jan 2007 ano
20.454
-9.468
-31.64%
1 jan 2008 ano
23.077
+2.623
12.82%
1 jan 2009 ano
20.313
-2.763
-11.97%
1 jan 2010 ano
13.603
-6.71
-33.03%
1 jan 2011 ano
15.712
+2.108
15.5%
1 jan 2012 ano
13.068
-2.644
-16.83%
1 jan 2013 ano
23.255
+10.187
77.95%
1 jan 2014 ano
19.24
-4.015
-17.26%
Classificação de países por estatísticas atuais por anos


Comentários: