29
/pt/
pt
AIzaSyAYiBZKx7MnpbEhh9jyipgxe19OcubqV5w
April 1, 2024
176280
Lebanon
LBN
true
2
1
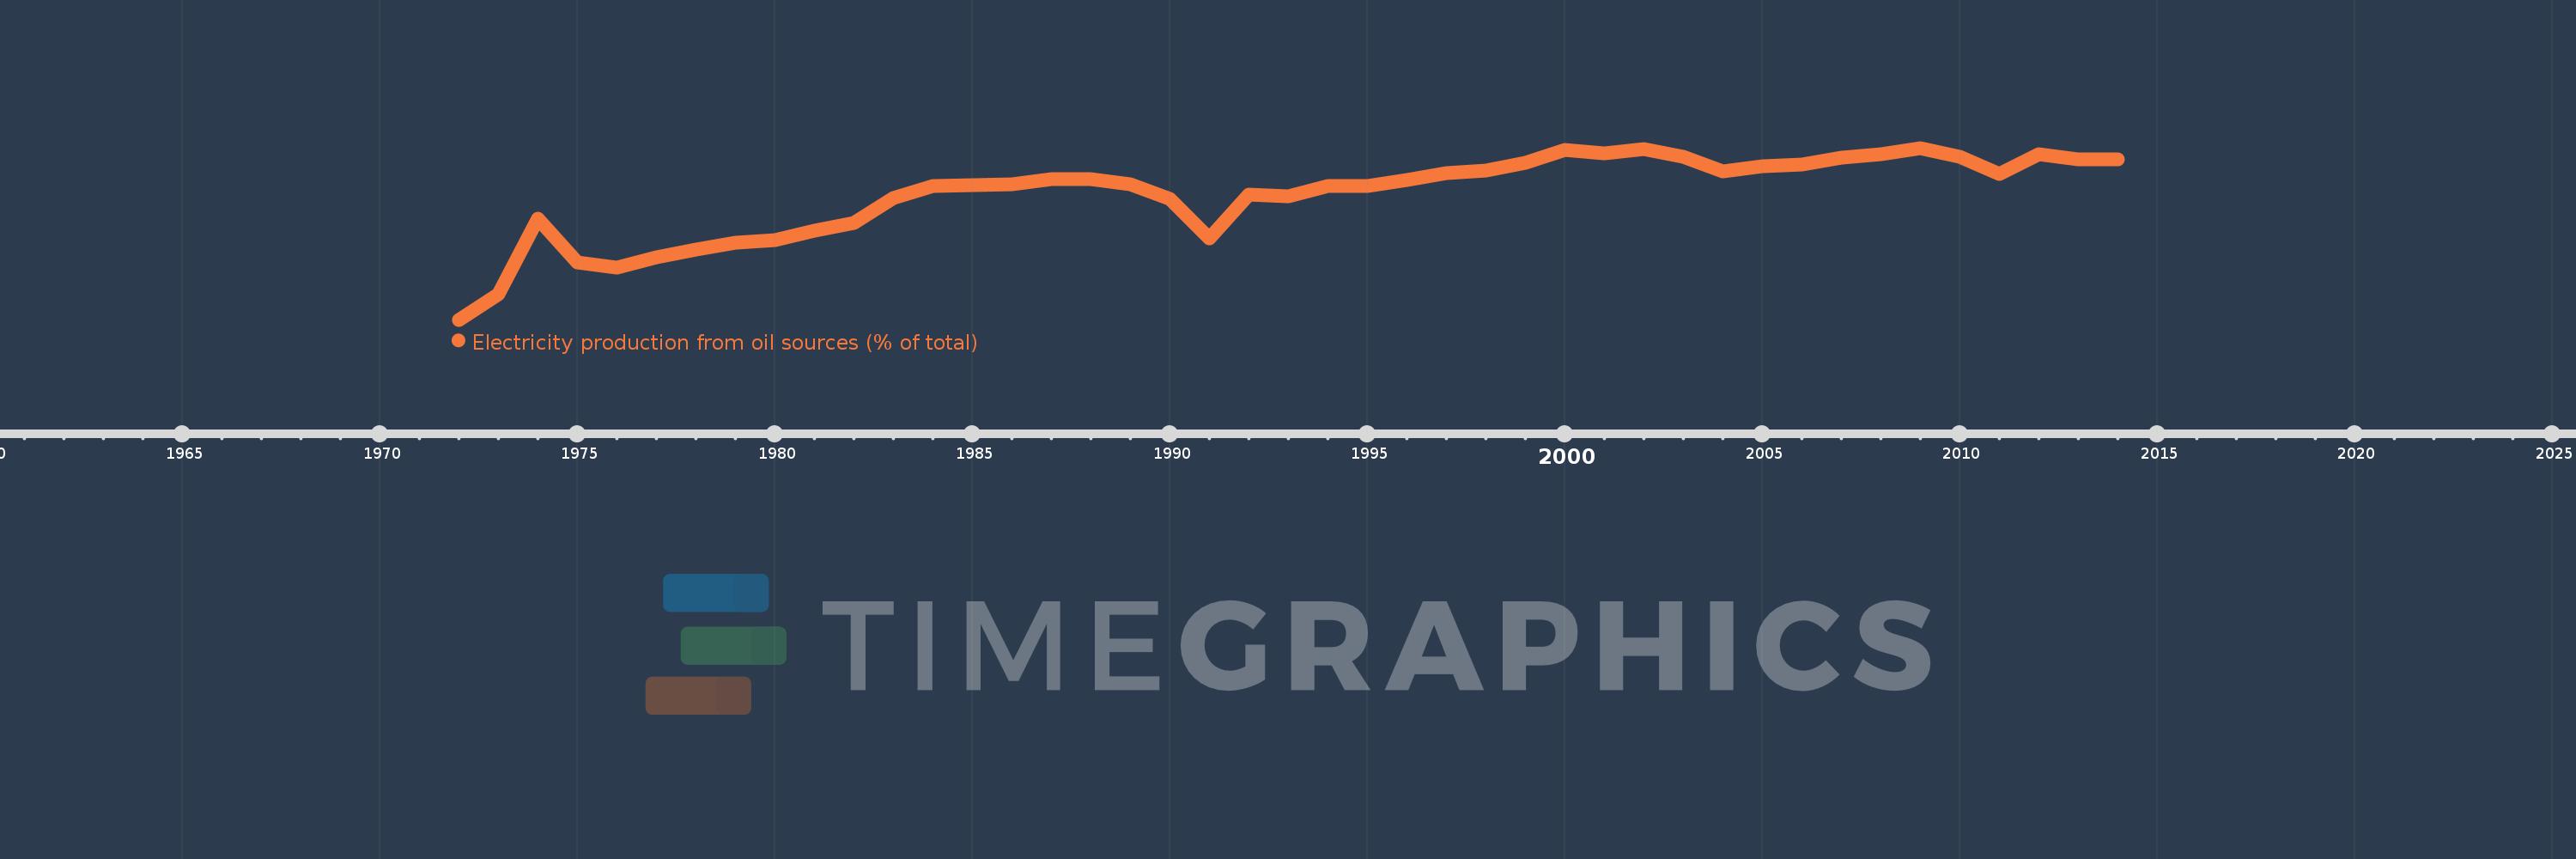
Electricity production from oil sources (% of total)
2014,2013,2012,2011,2010,2009,2008,2007,2006,2005,2004,2003,2002,2001,2000,1999,1998,1997,1996,1995,1994,1993,1992,1991,1990,1989,1988,1987,1986,1985,1984,1983,1982,1981,1980,1979,1978,1977,1976,1975,1974,1973,1972
Estas estatísticas em outros países:
AlbaniaAlgeriaAngolaArab WorldArgentinaArmeniaAustraliaAustriaAzerbaijanBahrainBangladeshBelarusBelgiumBeninBoliviaBosnia and HerzegovinaBotswanaBrazilBrunei DarussalamBulgariaCambodiaCameroonCanadaCentral Europe and the BalticsChileChinaColombiaCongo, Dem. Rep.Congo, Rep.Costa RicaCote d'IvoireCroatiaCubaCuracaoCyprusCzech RepublicDenmarkDominican RepublicEarly-demographic dividendEast Asia & PacificEast Asia & Pacific (excluding high income)East Asia & Pacific (IDA & IBRD countries)EcuadorEgypt, Arab Rep.El SalvadorEritreaEstoniaEthiopiaEuro areaEurope & Central AsiaEurope & Central Asia (excluding high income)Europe & Central Asia (IDA & IBRD countries)European UnionFinlandFragile and conflict affected situationsFranceGabonGeorgiaGermanyGhanaGibraltarGreeceGuatemalaHaitiHeavily indebted poor countries (HIPC)High incomeHondurasHong Kong SAR, ChinaHungaryIBRD onlyIcelandIDA & IBRD totalIDA blendIDA onlyIDA totalIndiaIndonesiaIran, Islamic Rep.IraqIrelandIsraelItalyJamaicaJapanJordanKazakhstanKenyaKorea, Dem. People’s Rep.Korea, Rep.KosovoKuwaitKyrgyz RepublicLate-demographic dividendLatin America & Caribbean Latin America & Caribbean (excluding high income)Latin America & the Caribbean (IDA & IBRD countries)LatviaLeast developed countries: UN classificationLebanonLibyaLithuaniaLow & middle incomeLower middle incomeLuxembourgMacedonia, FYRMalaysiaMaltaMauritiusMexicoMiddle East & North AfricaMiddle East & North Africa (excluding high income)Middle East & North Africa (IDA & IBRD countries)Middle incomeMoldovaMongoliaMontenegroMoroccoMozambiqueMyanmarNamibiaNepalNetherlandsNew ZealandNicaraguaNigerNigeriaNorth AmericaNorwayOECD membersOmanOther small statesPakistanPanamaParaguayPeruPhilippinesPolandPortugalPost-demographic dividendPre-demographic dividendQatarRomaniaRussian FederationSaudi ArabiaSenegalSerbiaSingaporeSlovak RepublicSloveniaSmall statesSouth AfricaSouth AsiaSouth Asia (IDA & IBRD)South SudanSpainSri LankaSub-Saharan Africa Sub-Saharan Africa (excluding high income)Sub-Saharan Africa (IDA & IBRD countries)SudanSwedenSwitzerlandSyrian Arab RepublicTajikistanTanzaniaThailandTogoTrinidad and TobagoTunisiaTurkeyTurkmenistanUkraineUnited Arab EmiratesUnited KingdomUnited StatesUpper middle incomeUruguayUzbekistanVenezuela, RBVietnamWorldYemen, Rep.ZambiaZimbabwe Linha do tempo:
Nesta escala de tempo está apresentado um gráfico de 1972 ano até 2014 ano Lebanon. Dados de 1971 ano ausente. O número de observações reais por data: 43.
Fonte (nome):
Indicadores de desenvolvimento mundial
Fonte (organização):
IEA Statistics © OECD/IEA 2014 (http://www.iea.org/stats/index.asp), subject to https://www.iea.org/t&c/termsandconditions/
Categorias:
Energy & Mining, Climate Change, Infrastructure
Foi atualizado:
23 abr 2017 ano
Indicadores de alterações dos valores ao longo dos anos
Mínimo:
38.982
1 jan 1972 ano
Máximo:
97.198
1 jan 2009 ano
Na data de observação
Valor
Mudança absoluta
A alteração em relação ao valor anterior
1 jan 1972 ano
38.982
+38.982
0.0%
1 jan 1973 ano
47.767
+8.785
22.54%
1 jan 1974 ano
73.311
+25.544
53.48%
1 jan 1975 ano
58.481
-14.83
-20.23%
1 jan 1976 ano
56.757
-1.724
-2.95%
1 jan 1977 ano
60.0
+3.243
5.71%
1 jan 1978 ano
62.791
+2.791
4.65%
1 jan 1979 ano
65.217
+2.427
3.86%
1 jan 1980 ano
66.0
+0.783
1.2%
1 jan 1981 ano
69.113
+3.113
4.72%
1 jan 1982 ano
71.667
+2.553
3.69%
1 jan 1983 ano
80.303
+8.636
12.05%
1 jan 1984 ano
84.444
+4.141
5.16%
1 jan 1985 ano
84.605
+0.161
0.19%
1 jan 1986 ano
84.848
+0.243
0.29%
1 jan 1987 ano
86.571
+1.722
2.03%
1 jan 1988 ano
86.739
+0.168
0.19%
1 jan 1989 ano
85.0
-1.739
-2.01%
1 jan 1990 ano
80.0
-5.0
-5.88%
1 jan 1991 ano
66.667
-13.333
-16.67%
1 jan 1992 ano
81.333
+14.667
22.0%
1 jan 1993 ano
80.907
-0.426
-0.52%
1 jan 1994 ano
84.211
+3.304
4.08%
1 jan 1995 ano
84.24
+0.029
0.03%
1 jan 1996 ano
86.423
+2.183
2.59%
1 jan 1997 ano
88.543
+2.12
2.45%
1 jan 1998 ano
89.419
+0.876
0.99%
1 jan 1999 ano
92.255
+2.836
3.17%
1 jan 2000 ano
96.67
+4.415
4.79%
1 jan 2001 ano
95.346
-1.324
-1.37%
1 jan 2002 ano
96.688
+1.342
1.41%
1 jan 2003 ano
94.156
-2.531
-2.62%
1 jan 2004 ano
89.141
-5.015
-5.33%
1 jan 2005 ano
90.929
+1.788
2.01%
1 jan 2006 ano
91.522
+0.593
0.65%
1 jan 2007 ano
93.975
+2.453
2.68%
1 jan 2008 ano
95.14
+1.164
1.24%
1 jan 2009 ano
97.198
+2.058
2.16%
1 jan 2010 ano
94.082
-3.116
-3.21%
1 jan 2011 ano
88.378
-5.703
-6.06%
1 jan 2012 ano
95.081
+6.703
7.58%
1 jan 2013 ano
93.208
-1.873
-1.97%
1 jan 2014 ano
93.39
+0.182
0.19%
Classificação de países por estatísticas atuais por anos


Comentários: