29
/pt/
pt
AIzaSyAYiBZKx7MnpbEhh9jyipgxe19OcubqV5w
April 1, 2024
115708
Cuba
CUB
true
2
1
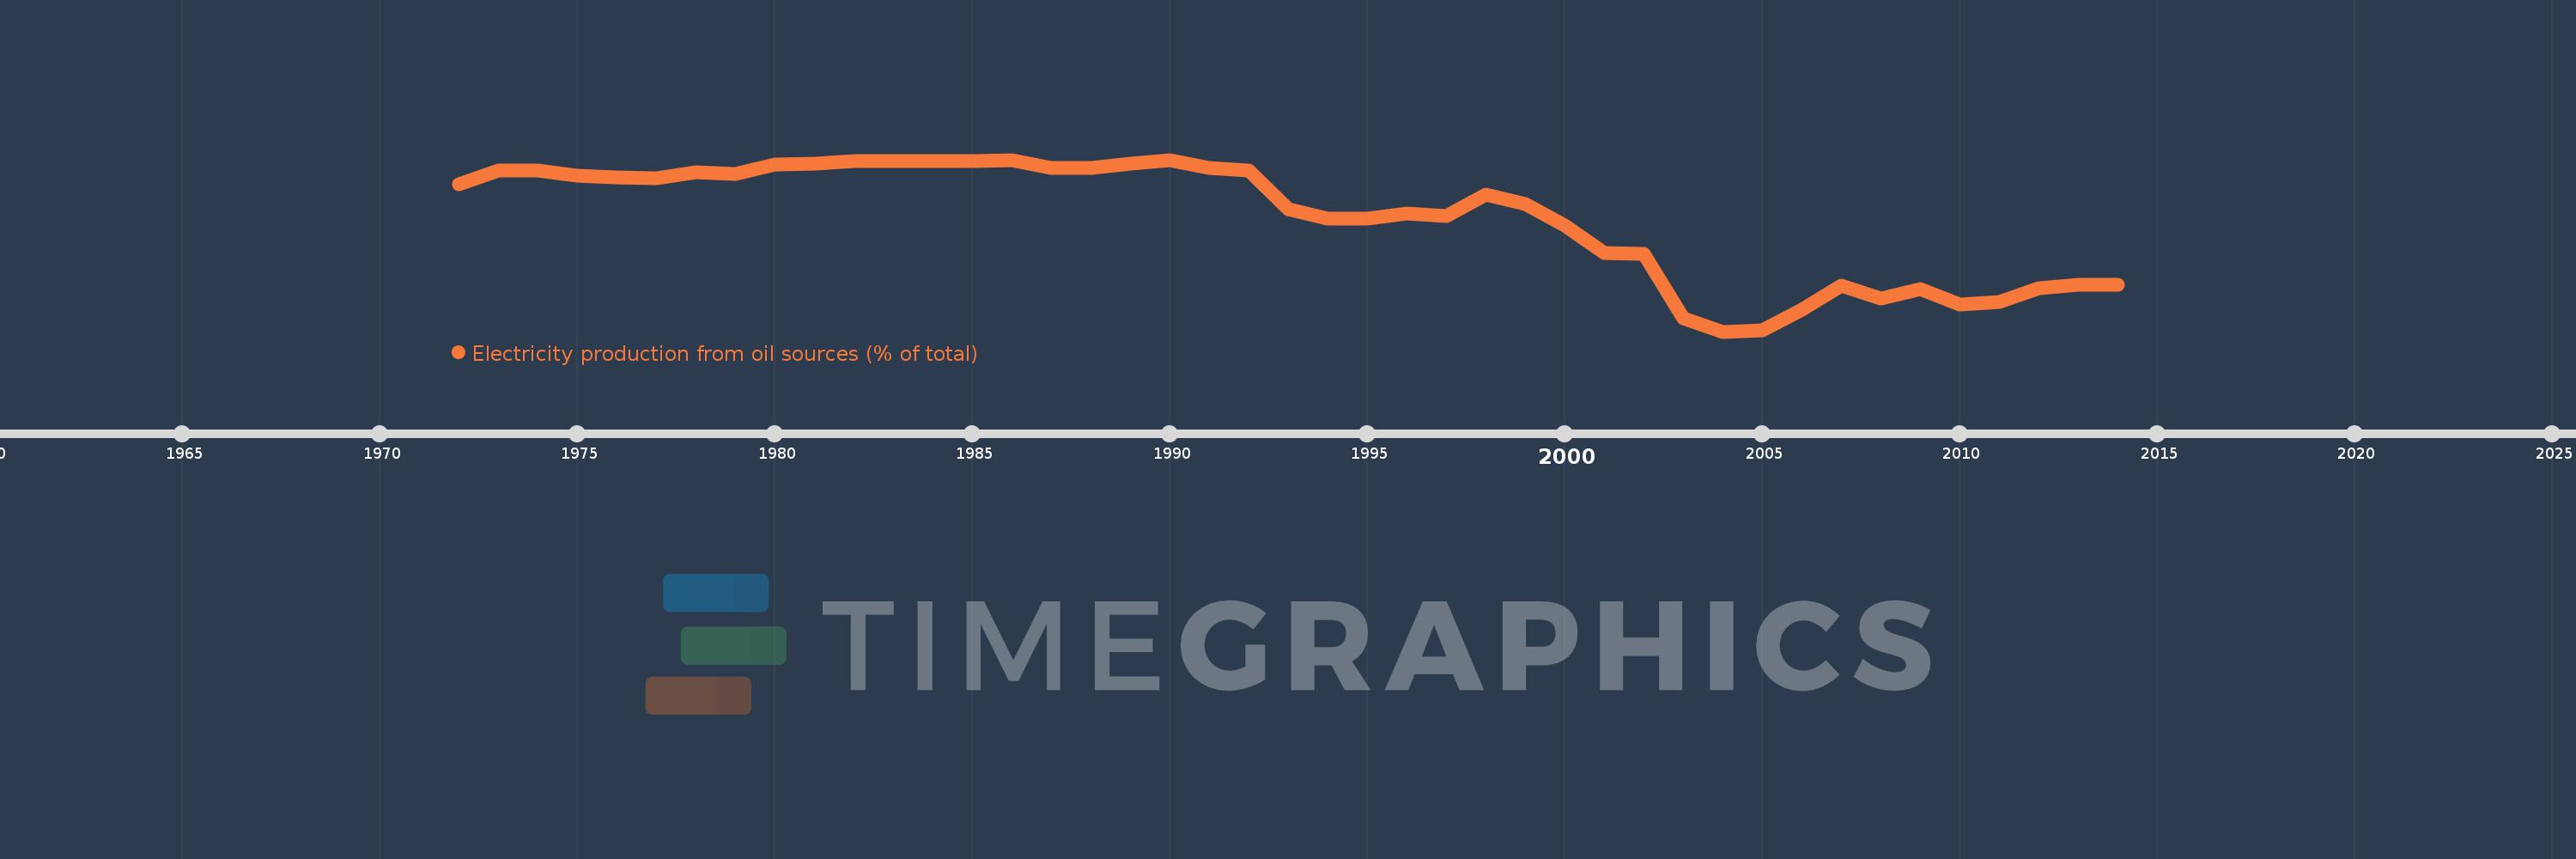
Electricity production from oil sources (% of total)
2014,2013,2012,2011,2010,2009,2008,2007,2006,2005,2004,2003,2002,2001,2000,1999,1998,1997,1996,1995,1994,1993,1992,1991,1990,1989,1988,1987,1986,1985,1984,1983,1982,1981,1980,1979,1978,1977,1976,1975,1974,1973,1972
Estas estatísticas em outros países:
AlbaniaAlgeriaAngolaArab WorldArgentinaArmeniaAustraliaAustriaAzerbaijanBahrainBangladeshBelarusBelgiumBeninBoliviaBosnia and HerzegovinaBotswanaBrazilBrunei DarussalamBulgariaCambodiaCameroonCanadaCentral Europe and the BalticsChileChinaColombiaCongo, Dem. Rep.Congo, Rep.Costa RicaCote d'IvoireCroatiaCubaCuracaoCyprusCzech RepublicDenmarkDominican RepublicEarly-demographic dividendEast Asia & PacificEast Asia & Pacific (excluding high income)East Asia & Pacific (IDA & IBRD countries)EcuadorEgypt, Arab Rep.El SalvadorEritreaEstoniaEthiopiaEuro areaEurope & Central AsiaEurope & Central Asia (excluding high income)Europe & Central Asia (IDA & IBRD countries)European UnionFinlandFragile and conflict affected situationsFranceGabonGeorgiaGermanyGhanaGibraltarGreeceGuatemalaHaitiHeavily indebted poor countries (HIPC)High incomeHondurasHong Kong SAR, ChinaHungaryIBRD onlyIcelandIDA & IBRD totalIDA blendIDA onlyIDA totalIndiaIndonesiaIran, Islamic Rep.IraqIrelandIsraelItalyJamaicaJapanJordanKazakhstanKenyaKorea, Dem. People’s Rep.Korea, Rep.KosovoKuwaitKyrgyz RepublicLate-demographic dividendLatin America & Caribbean Latin America & Caribbean (excluding high income)Latin America & the Caribbean (IDA & IBRD countries)LatviaLeast developed countries: UN classificationLebanonLibyaLithuaniaLow & middle incomeLower middle incomeLuxembourgMacedonia, FYRMalaysiaMaltaMauritiusMexicoMiddle East & North AfricaMiddle East & North Africa (excluding high income)Middle East & North Africa (IDA & IBRD countries)Middle incomeMoldovaMongoliaMontenegroMoroccoMozambiqueMyanmarNamibiaNepalNetherlandsNew ZealandNicaraguaNigerNigeriaNorth AmericaNorwayOECD membersOmanOther small statesPakistanPanamaParaguayPeruPhilippinesPolandPortugalPost-demographic dividendPre-demographic dividendQatarRomaniaRussian FederationSaudi ArabiaSenegalSerbiaSingaporeSlovak RepublicSloveniaSmall statesSouth AfricaSouth AsiaSouth Asia (IDA & IBRD)South SudanSpainSri LankaSub-Saharan Africa Sub-Saharan Africa (excluding high income)Sub-Saharan Africa (IDA & IBRD countries)SudanSwedenSwitzerlandSyrian Arab RepublicTajikistanTanzaniaThailandTogoTrinidad and TobagoTunisiaTurkeyTurkmenistanUkraineUnited Arab EmiratesUnited KingdomUnited StatesUpper middle incomeUruguayUzbekistanVenezuela, RBVietnamWorldYemen, Rep.ZambiaZimbabwe Linha do tempo:
Nesta escala de tempo está apresentado um gráfico de 1972 ano até 2014 ano Cuba. Dados de 1971 ano ausente. O número de observações reais por data: 43.
Fonte (nome):
Indicadores de desenvolvimento mundial
Fonte (organização):
IEA Statistics © OECD/IEA 2014 (http://www.iea.org/stats/index.asp), subject to https://www.iea.org/t&c/termsandconditions/
Categorias:
Energy & Mining, Climate Change, Infrastructure
Foi atualizado:
23 abr 2017 ano
Indicadores de alterações dos valores ao longo dos anos
Mínimo:
29.077
1 jan 2004 ano
Máximo:
90.255
1 jan 1990 ano
Na data de observação
Valor
Mudança absoluta
A alteração em relação ao valor anterior
1 jan 1972 ano
81.534
+81.534
0.0%
1 jan 1973 ano
86.354
+4.82
5.91%
1 jan 1974 ano
86.317
-0.037
-0.04%
1 jan 1975 ano
84.532
-1.785
-2.07%
1 jan 1976 ano
83.94
-0.592
-0.7%
1 jan 1977 ano
83.572
-0.369
-0.44%
1 jan 1978 ano
85.97
+2.398
2.87%
1 jan 1979 ano
85.243
-0.727
-0.85%
1 jan 1980 ano
88.449
+3.206
3.76%
1 jan 1981 ano
89.008
+0.559
0.63%
1 jan 1982 ano
89.787
+0.779
0.88%
1 jan 1983 ano
89.921
+0.133
0.15%
1 jan 1984 ano
89.725
-0.196
-0.22%
1 jan 1985 ano
89.749
+0.024
0.03%
1 jan 1986 ano
89.966
+0.218
0.24%
1 jan 1987 ano
87.356
-2.611
-2.9%
1 jan 1988 ano
87.398
+0.042
0.05%
1 jan 1989 ano
88.819
+1.421
1.63%
1 jan 1990 ano
90.255
+1.437
1.62%
1 jan 1991 ano
87.453
-2.802
-3.1%
1 jan 1992 ano
86.525
-0.928
-1.06%
1 jan 1993 ano
72.569
-13.956
-16.13%
1 jan 1994 ano
69.287
-3.282
-4.52%
1 jan 1995 ano
69.352
+0.065
0.09%
1 jan 1996 ano
71.282
+1.93
2.78%
1 jan 1997 ano
70.202
-1.079
-1.51%
1 jan 1998 ano
77.881
+7.678
10.94%
1 jan 1999 ano
74.484
-3.397
-4.36%
1 jan 2000 ano
66.789
-7.695
-10.33%
1 jan 2001 ano
57.065
-9.724
-14.56%
1 jan 2002 ano
56.716
-0.349
-0.61%
1 jan 2003 ano
33.875
-22.841
-40.27%
1 jan 2004 ano
29.077
-4.798
-14.16%
1 jan 2005 ano
29.417
+0.34
1.17%
1 jan 2006 ano
36.84
+7.423
25.24%
1 jan 2007 ano
45.34
+8.5
23.07%
1 jan 2008 ano
40.933
-4.407
-9.72%
1 jan 2009 ano
44.131
+3.199
7.81%
1 jan 2010 ano
38.604
-5.528
-12.53%
1 jan 2011 ano
39.53
+0.926
2.4%
1 jan 2012 ano
44.471
+4.941
12.5%
1 jan 2013 ano
45.659
+1.188
2.67%
1 jan 2014 ano
45.831
+0.172
0.38%
Classificação de países por estatísticas atuais por anos


Comentários: