29
/pt/
pt
AIzaSyAYiBZKx7MnpbEhh9jyipgxe19OcubqV5w
April 1, 2024
248589
Sri Lanka
LKA
true
2
1
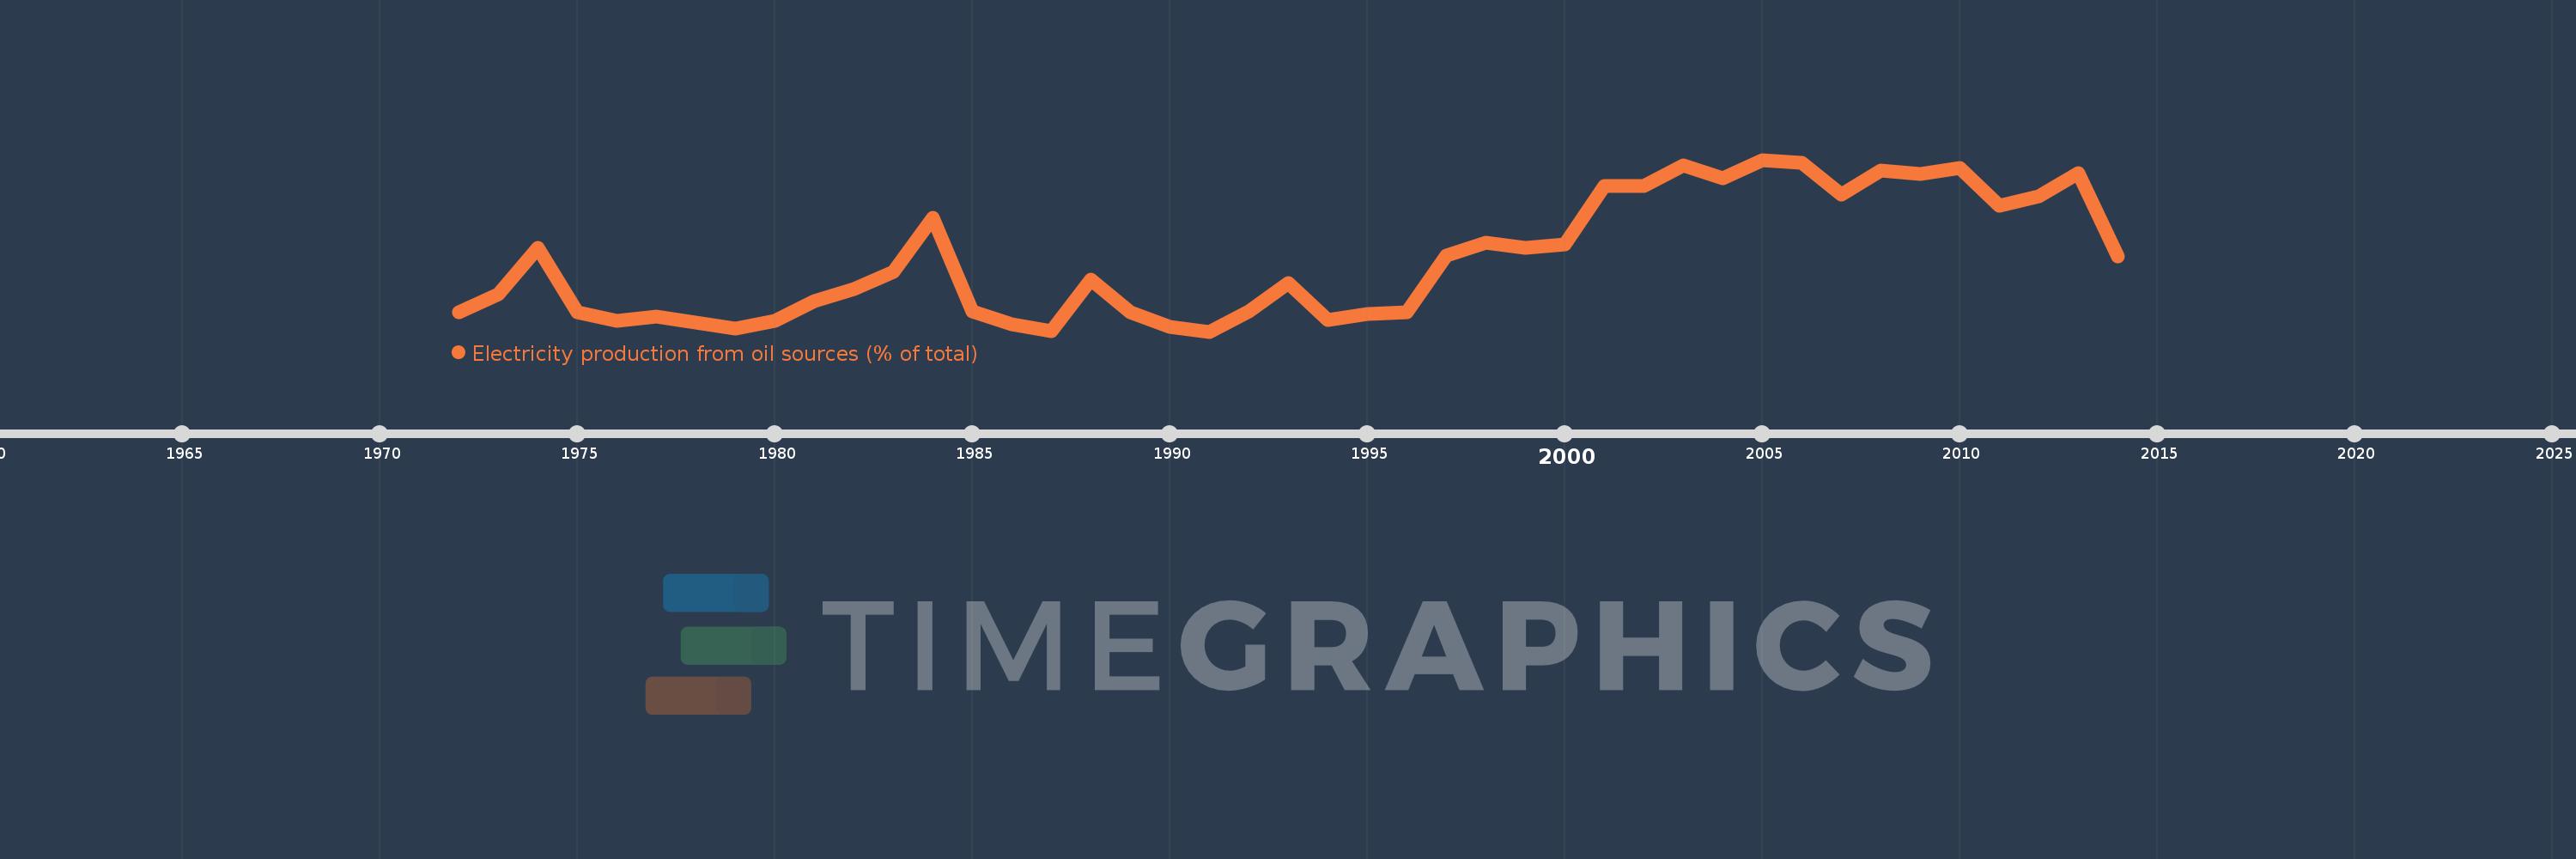
Electricity production from oil sources (% of total)
2014,2013,2012,2011,2010,2009,2008,2007,2006,2005,2004,2003,2002,2001,2000,1999,1998,1997,1996,1995,1994,1993,1992,1991,1990,1989,1988,1987,1986,1985,1984,1983,1982,1981,1980,1979,1978,1977,1976,1975,1974,1973,1972
Estas estatísticas em outros países:
AlbaniaAlgeriaAngolaArab WorldArgentinaArmeniaAustraliaAustriaAzerbaijanBahrainBangladeshBelarusBelgiumBeninBoliviaBosnia and HerzegovinaBotswanaBrazilBrunei DarussalamBulgariaCambodiaCameroonCanadaCentral Europe and the BalticsChileChinaColombiaCongo, Dem. Rep.Congo, Rep.Costa RicaCote d'IvoireCroatiaCubaCuracaoCyprusCzech RepublicDenmarkDominican RepublicEarly-demographic dividendEast Asia & PacificEast Asia & Pacific (excluding high income)East Asia & Pacific (IDA & IBRD countries)EcuadorEgypt, Arab Rep.El SalvadorEritreaEstoniaEthiopiaEuro areaEurope & Central AsiaEurope & Central Asia (excluding high income)Europe & Central Asia (IDA & IBRD countries)European UnionFinlandFragile and conflict affected situationsFranceGabonGeorgiaGermanyGhanaGibraltarGreeceGuatemalaHaitiHeavily indebted poor countries (HIPC)High incomeHondurasHong Kong SAR, ChinaHungaryIBRD onlyIcelandIDA & IBRD totalIDA blendIDA onlyIDA totalIndiaIndonesiaIran, Islamic Rep.IraqIrelandIsraelItalyJamaicaJapanJordanKazakhstanKenyaKorea, Dem. People’s Rep.Korea, Rep.KosovoKuwaitKyrgyz RepublicLate-demographic dividendLatin America & Caribbean Latin America & Caribbean (excluding high income)Latin America & the Caribbean (IDA & IBRD countries)LatviaLeast developed countries: UN classificationLebanonLibyaLithuaniaLow & middle incomeLower middle incomeLuxembourgMacedonia, FYRMalaysiaMaltaMauritiusMexicoMiddle East & North AfricaMiddle East & North Africa (excluding high income)Middle East & North Africa (IDA & IBRD countries)Middle incomeMoldovaMongoliaMontenegroMoroccoMozambiqueMyanmarNamibiaNepalNetherlandsNew ZealandNicaraguaNigerNigeriaNorth AmericaNorwayOECD membersOmanOther small statesPakistanPanamaParaguayPeruPhilippinesPolandPortugalPost-demographic dividendPre-demographic dividendQatarRomaniaRussian FederationSaudi ArabiaSenegalSerbiaSingaporeSlovak RepublicSloveniaSmall statesSouth AfricaSouth AsiaSouth Asia (IDA & IBRD)South SudanSpainSri LankaSub-Saharan Africa Sub-Saharan Africa (excluding high income)Sub-Saharan Africa (IDA & IBRD countries)SudanSwedenSwitzerlandSyrian Arab RepublicTajikistanTanzaniaThailandTogoTrinidad and TobagoTunisiaTurkeyTurkmenistanUkraineUnited Arab EmiratesUnited KingdomUnited StatesUpper middle incomeUruguayUzbekistanVenezuela, RBVietnamWorldYemen, Rep.ZambiaZimbabwe Linha do tempo:
Nesta escala de tempo está apresentado um gráfico de 1972 ano até 2014 ano Sri Lanka. Dados de 1971 ano ausente. O número de observações reais por data: 43.
Fonte (nome):
Indicadores de desenvolvimento mundial
Fonte (organização):
IEA Statistics © OECD/IEA 2014 (http://www.iea.org/stats/index.asp), subject to https://www.iea.org/t&c/termsandconditions/
Categorias:
Energy & Mining, Climate Change, Infrastructure
Foi atualizado:
23 abr 2017 ano
Indicadores de alterações dos valores ao longo dos anos
Mínimo:
0.159
1 jan 1991 ano
Máximo:
63.862
1 jan 2005 ano
Na data de observação
Valor
Mudança absoluta
A alteração em relação ao valor anterior
1 jan 1972 ano
7.333
+7.333
0.0%
1 jan 1973 ano
13.97
+6.637
90.5%
1 jan 1974 ano
31.329
+17.359
124.26%
1 jan 1975 ano
7.229
-24.1
-76.93%
1 jan 1976 ano
4.091
-3.138
-43.41%
1 jan 1977 ano
5.657
+1.567
38.3%
1 jan 1978 ano
3.652
-2.005
-35.45%
1 jan 1979 ano
1.372
-2.28
-62.43%
1 jan 1980 ano
4.197
+2.825
205.92%
1 jan 1981 ano
11.331
+7.134
169.99%
1 jan 1982 ano
16.026
+4.695
41.43%
1 jan 1983 ano
22.168
+6.143
38.33%
1 jan 1984 ano
42.431
+20.263
91.4%
1 jan 1985 ano
7.519
-34.913
-82.28%
1 jan 1986 ano
2.8
-4.718
-62.76%
1 jan 1987 ano
0.264
-2.536
-90.57%
1 jan 1988 ano
19.579
+19.315
7.32 mil%
1 jan 1989 ano
7.217
-12.362
-63.14%
1 jan 1990 ano
1.959
-5.257
-72.85%
1 jan 1991 ano
0.159
-1.801
-91.9%
1 jan 1992 ano
7.729
+7.57
4.77 mil%
1 jan 1993 ano
18.079
+10.35
133.92%
1 jan 1994 ano
4.599
-13.48
-74.56%
1 jan 1995 ano
6.793
+2.194
47.7%
1 jan 1996 ano
7.289
+0.496
7.3%
1 jan 1997 ano
28.212
+20.923
287.07%
1 jan 1998 ano
33.003
+4.791
16.98%
1 jan 1999 ano
31.11
-1.893
-5.73%
1 jan 2000 ano
32.519
+1.409
4.53%
1 jan 2001 ano
54.198
+21.678
66.66%
1 jan 2002 ano
53.989
-0.209
-0.38%
1 jan 2003 ano
61.817
+7.828
14.5%
1 jan 2004 ano
57.102
-4.715
-7.63%
1 jan 2005 ano
63.862
+6.759
11.84%
1 jan 2006 ano
62.773
-1.088
-1.7%
1 jan 2007 ano
51.0
-11.773
-18.76%
1 jan 2008 ano
59.933
+8.933
17.52%
1 jan 2009 ano
58.461
-1.473
-2.46%
1 jan 2010 ano
60.705
+2.244
3.84%
1 jan 2011 ano
46.885
-13.82
-22.77%
1 jan 2012 ano
50.249
+3.364
7.18%
1 jan 2013 ano
58.961
+8.713
17.34%
1 jan 2014 ano
27.905
-31.057
-52.67%
Classificação de países por estatísticas atuais por anos


Comentários: