29
/pt/
pt
AIzaSyAYiBZKx7MnpbEhh9jyipgxe19OcubqV5w
April 1, 2024
54890
Post-demographic dividend
PST
false
2
1
Interest payments (% of expense)
2015,2014,2013,2012,2011,2010,2009,2008,2007,2006,2005,2004,2003,2002,2001,2000,1999,1998,1997,1996,1995,1994,1993,1992,1991,1990,1989,1988,1987,1986,1985,1984,1983,1982,1981,1980,1979,1978,1977,1976,1975,1974,1973
Estas estatísticas em outros países:
AfghanistanAlbaniaAlgeriaAngolaAntigua and BarbudaArab WorldArmeniaAustraliaAustriaAzerbaijanBahamas, TheBahrainBangladeshBarbadosBelarusBelgiumBelizeBeninBhutanBoliviaBosnia and HerzegovinaBotswanaBrazilBulgariaBurkina FasoBurundiCabo VerdeCambodiaCanadaCaribbean small statesCentral African RepublicCentral Europe and the BalticsChileColombiaCongo, Dem. Rep.Congo, Rep.Costa RicaCote d'IvoireCroatiaCyprusCzech RepublicDenmarkDominicaDominican RepublicEarly-demographic dividendEast Asia & PacificEast Asia & Pacific (excluding high income)East Asia & Pacific (IDA & IBRD countries)Egypt, Arab Rep.El SalvadorEquatorial GuineaEstoniaEthiopiaEuro areaEurope & Central AsiaEurope & Central Asia (excluding high income)Europe & Central Asia (IDA & IBRD countries)European UnionFijiFinlandFranceGambia, TheGeorgiaGermanyGhanaGreeceGrenadaGuatemalaHeavily indebted poor countries (HIPC)High incomeHondurasHong Kong SAR, ChinaHungaryIBRD onlyIcelandIDA & IBRD totalIDA blendIDA onlyIDA totalIndiaIndonesiaIran, Islamic Rep.IraqIrelandIsraelItalyJamaicaJapanJordanKazakhstanKenyaKiribatiKorea, Rep.KuwaitKyrgyz RepublicLao PDRLate-demographic dividendLatin America & Caribbean Latin America & Caribbean (excluding high income)Latin America & the Caribbean (IDA & IBRD countries)LatviaLeast developed countries: UN classificationLebanonLesothoLiberiaLithuaniaLow & middle incomeLow incomeLower middle incomeLuxembourgMacao SAR, ChinaMacedonia, FYRMadagascarMalawiMalaysiaMaldivesMaliMaltaMauritiusMexicoMicronesia, Fed. Sts.Middle East & North AfricaMiddle East & North Africa (excluding high income)Middle East & North Africa (IDA & IBRD countries)Middle incomeMoldovaMongoliaMoroccoMozambiqueNamibiaNepalNetherlandsNew ZealandNicaraguaNigeriaNorth AmericaNorwayOECD membersOmanOther small statesPakistanPanamaPapua New GuineaParaguayPeruPhilippinesPolandPortugalPost-demographic dividendPre-demographic dividendQatarRomaniaRussian FederationRwandaSamoaSan MarinoSao Tome and PrincipeSenegalSerbiaSeychellesSierra LeoneSingaporeSlovak RepublicSloveniaSmall statesSolomon IslandsSouth AfricaSouth AsiaSouth Asia (IDA & IBRD)SpainSri LankaSt. Kitts and NevisSt. LuciaSub-Saharan Africa Sub-Saharan Africa (excluding high income)Sub-Saharan Africa (IDA & IBRD countries)SurinameSwazilandSwedenSwitzerlandSyrian Arab RepublicTajikistanTanzaniaThailandTimor-LesteTogoTrinidad and TobagoTunisiaTurkeyUgandaUkraineUnited KingdomUnited StatesUpper middle incomeUruguayVanuatuVenezuela, RBVietnamWest Bank and GazaWorldYemen, Rep.ZambiaZimbabwe Linha do tempo:
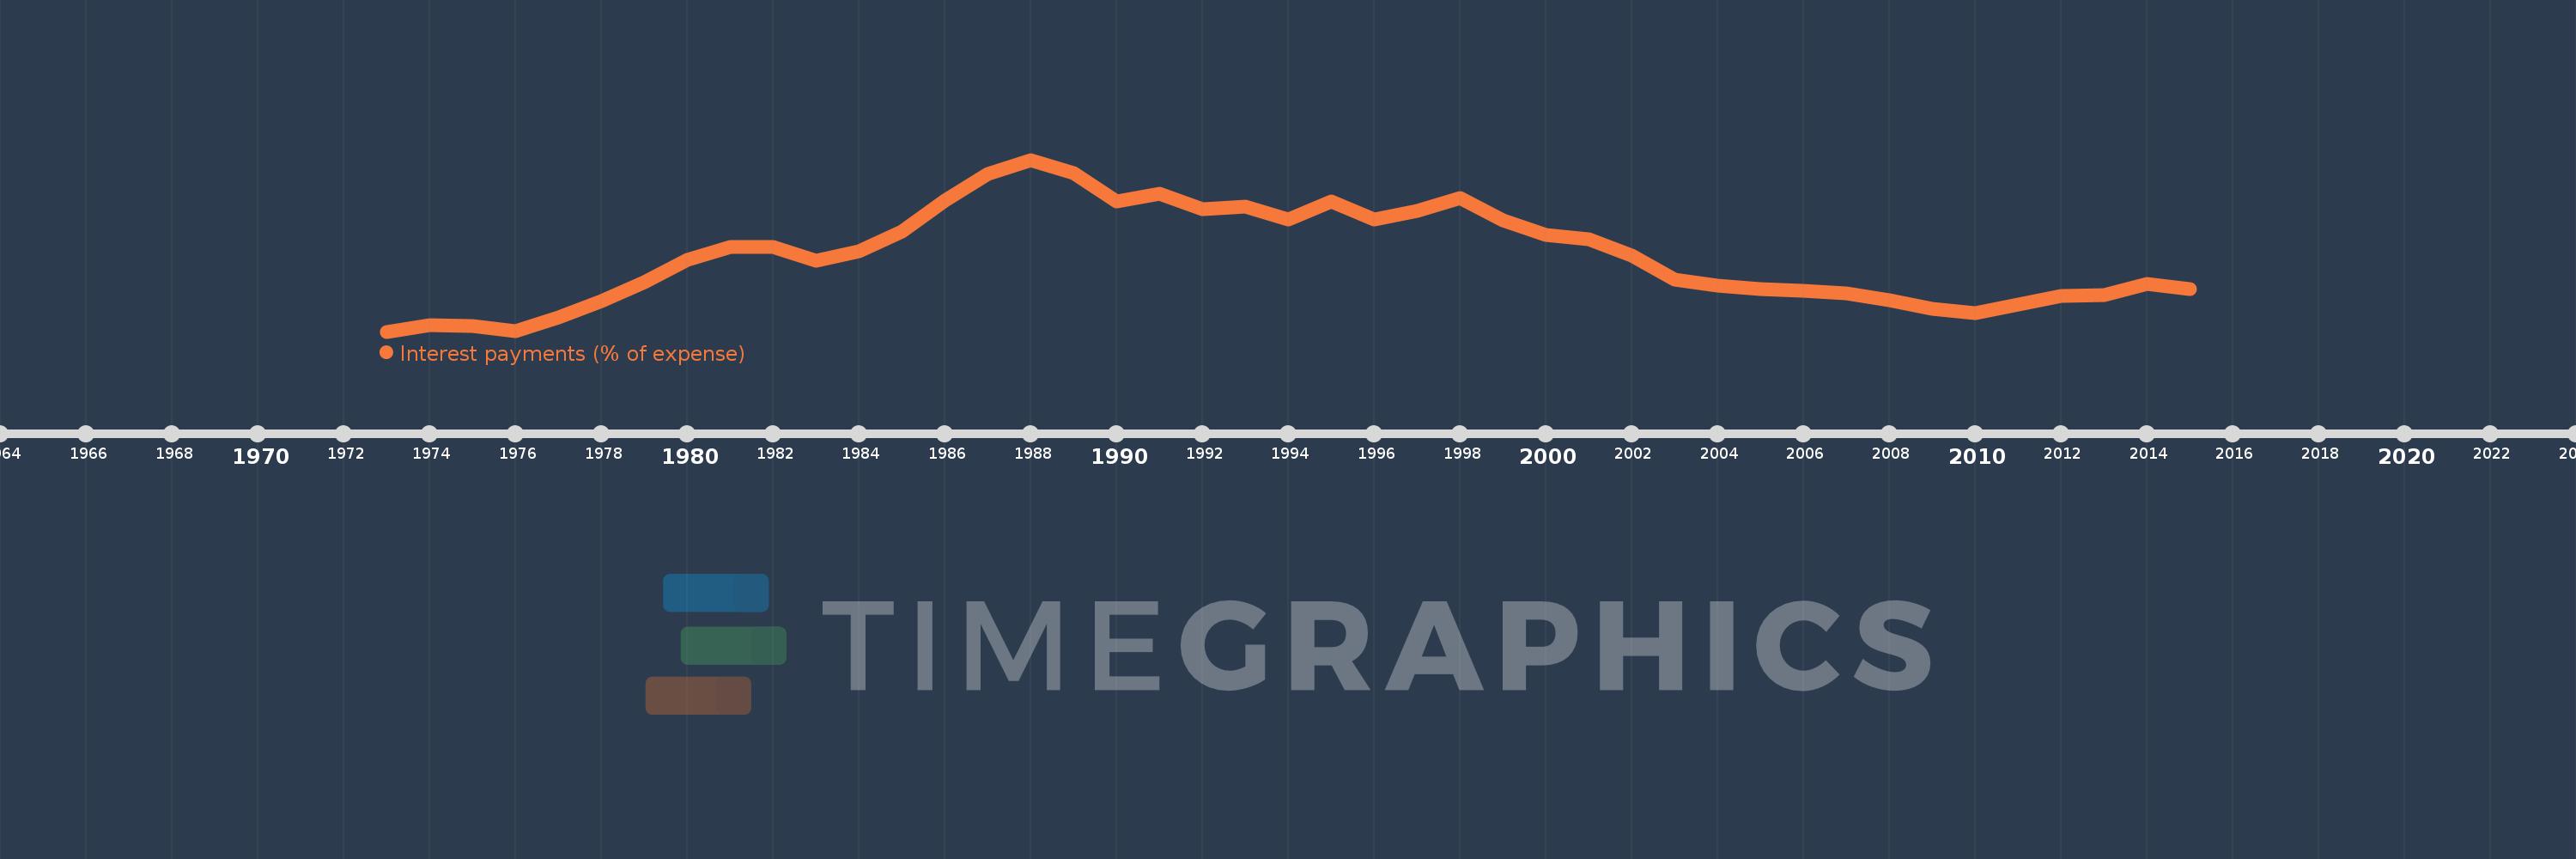
Nesta escala de tempo está apresentado um gráfico de 1973 ano até 2015 ano Post-demographic dividend. Dados de 1972 ano ausente. O número de observações reais por data: 43.
Fonte (nome):
Indicadores de desenvolvimento mundial
Fonte (organização):
International Monetary Fund, Government Finance Statistics Yearbook and data files.
Categorias:
Public Sector
Foi atualizado:
23 abr 2017 ano
Indicadores de alterações dos valores ao longo dos anos
Mínimo:
3.321
1 jan 1973 ano
Máximo:
11.132
1 jan 1988 ano
Na data de observação
Valor
Mudança absoluta
A alteração em relação ao valor anterior
1 jan 1973 ano
3.321
+3.321
0.0%
1 jan 1974 ano
3.603
+0.282
8.49%
1 jan 1975 ano
3.568
-0.035
-0.98%
1 jan 1976 ano
3.358
-0.209
-5.87%
1 jan 1977 ano
3.982
+0.623
18.56%
1 jan 1978 ano
4.705
+0.723
18.16%
1 jan 1979 ano
5.554
+0.849
18.05%
1 jan 1980 ano
6.585
+1.031
18.57%
1 jan 1981 ano
7.168
+0.583
8.85%
1 jan 1982 ano
7.159
-0.009
-0.12%
1 jan 1983 ano
6.531
-0.628
-8.78%
1 jan 1984 ano
6.973
+0.442
6.77%
1 jan 1985 ano
7.873
+0.9
12.9%
1 jan 1986 ano
9.289
+1.416
17.98%
1 jan 1987 ano
10.507
+1.219
13.12%
1 jan 1988 ano
11.132
+0.625
5.95%
1 jan 1989 ano
10.521
-0.611
-5.49%
1 jan 1990 ano
9.237
-1.284
-12.2%
1 jan 1991 ano
9.591
+0.354
3.83%
1 jan 1992 ano
8.882
-0.709
-7.4%
1 jan 1993 ano
9.022
+0.14
1.58%
1 jan 1994 ano
8.414
-0.608
-6.74%
1 jan 1995 ano
9.244
+0.831
9.87%
1 jan 1996 ano
8.414
-0.83
-8.98%
1 jan 1997 ano
8.827
+0.413
4.91%
1 jan 1998 ano
9.388
+0.561
6.36%
1 jan 1999 ano
8.376
-1.012
-10.78%
1 jan 2000 ano
7.732
-0.644
-7.69%
1 jan 2001 ano
7.521
-0.211
-2.73%
1 jan 2002 ano
6.768
-0.752
-10.0%
1 jan 2003 ano
5.68
-1.089
-16.08%
1 jan 2004 ano
5.415
-0.265
-4.67%
1 jan 2005 ano
5.254
-0.16
-2.96%
1 jan 2006 ano
5.186
-0.068
-1.3%
1 jan 2007 ano
5.051
-0.135
-2.61%
1 jan 2008 ano
4.764
-0.287
-5.68%
1 jan 2009 ano
4.369
-0.395
-8.29%
1 jan 2010 ano
4.174
-0.195
-4.47%
1 jan 2011 ano
4.541
+0.367
8.8%
1 jan 2012 ano
4.943
+0.402
8.85%
1 jan 2013 ano
4.989
+0.046
0.94%
1 jan 2014 ano
5.506
+0.517
10.37%
1 jan 2015 ano
5.237
-0.269
-4.88%
Classificação de países por estatísticas atuais por anos


Comentários: