29
/pt/
pt
AIzaSyAYiBZKx7MnpbEhh9jyipgxe19OcubqV5w
April 1, 2024
52718
OECD members
OED
false
2
1
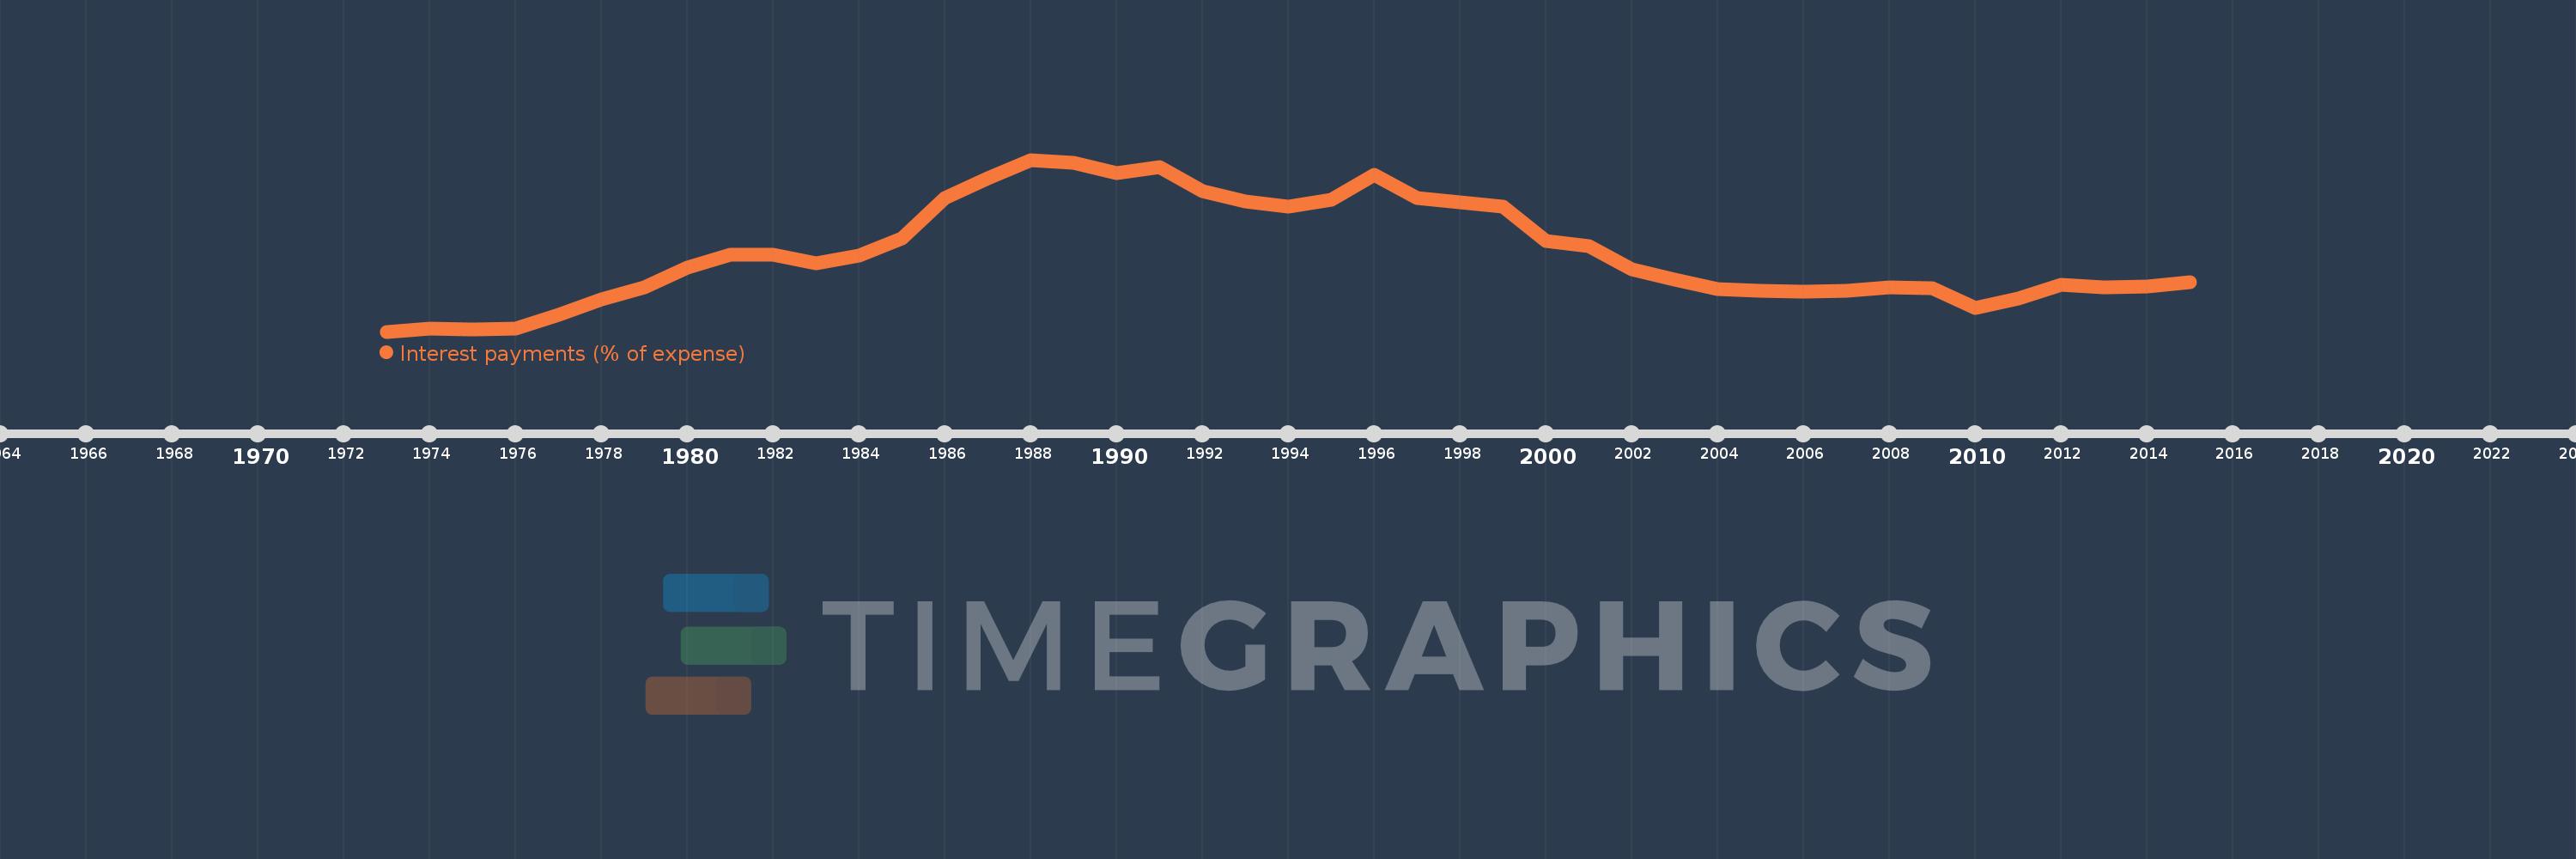
Interest payments (% of expense)
2015,2014,2013,2012,2011,2010,2009,2008,2007,2006,2005,2004,2003,2002,2001,2000,1999,1998,1997,1996,1995,1994,1993,1992,1991,1990,1989,1988,1987,1986,1985,1984,1983,1982,1981,1980,1979,1978,1977,1976,1975,1974,1973
Estas estatísticas em outros países:
AfghanistanAlbaniaAlgeriaAngolaAntigua and BarbudaArab WorldArmeniaAustraliaAustriaAzerbaijanBahamas, TheBahrainBangladeshBarbadosBelarusBelgiumBelizeBeninBhutanBoliviaBosnia and HerzegovinaBotswanaBrazilBulgariaBurkina FasoBurundiCabo VerdeCambodiaCanadaCaribbean small statesCentral African RepublicCentral Europe and the BalticsChileColombiaCongo, Dem. Rep.Congo, Rep.Costa RicaCote d'IvoireCroatiaCyprusCzech RepublicDenmarkDominicaDominican RepublicEarly-demographic dividendEast Asia & PacificEast Asia & Pacific (excluding high income)East Asia & Pacific (IDA & IBRD countries)Egypt, Arab Rep.El SalvadorEquatorial GuineaEstoniaEthiopiaEuro areaEurope & Central AsiaEurope & Central Asia (excluding high income)Europe & Central Asia (IDA & IBRD countries)European UnionFijiFinlandFranceGambia, TheGeorgiaGermanyGhanaGreeceGrenadaGuatemalaHeavily indebted poor countries (HIPC)High incomeHondurasHong Kong SAR, ChinaHungaryIBRD onlyIcelandIDA & IBRD totalIDA blendIDA onlyIDA totalIndiaIndonesiaIran, Islamic Rep.IraqIrelandIsraelItalyJamaicaJapanJordanKazakhstanKenyaKiribatiKorea, Rep.KuwaitKyrgyz RepublicLao PDRLate-demographic dividendLatin America & Caribbean Latin America & Caribbean (excluding high income)Latin America & the Caribbean (IDA & IBRD countries)LatviaLeast developed countries: UN classificationLebanonLesothoLiberiaLithuaniaLow & middle incomeLow incomeLower middle incomeLuxembourgMacao SAR, ChinaMacedonia, FYRMadagascarMalawiMalaysiaMaldivesMaliMaltaMauritiusMexicoMicronesia, Fed. Sts.Middle East & North AfricaMiddle East & North Africa (excluding high income)Middle East & North Africa (IDA & IBRD countries)Middle incomeMoldovaMongoliaMoroccoMozambiqueNamibiaNepalNetherlandsNew ZealandNicaraguaNigeriaNorth AmericaNorwayOECD membersOmanOther small statesPakistanPanamaPapua New GuineaParaguayPeruPhilippinesPolandPortugalPost-demographic dividendPre-demographic dividendQatarRomaniaRussian FederationRwandaSamoaSan MarinoSao Tome and PrincipeSenegalSerbiaSeychellesSierra LeoneSingaporeSlovak RepublicSloveniaSmall statesSolomon IslandsSouth AfricaSouth AsiaSouth Asia (IDA & IBRD)SpainSri LankaSt. Kitts and NevisSt. LuciaSub-Saharan Africa Sub-Saharan Africa (excluding high income)Sub-Saharan Africa (IDA & IBRD countries)SurinameSwazilandSwedenSwitzerlandSyrian Arab RepublicTajikistanTanzaniaThailandTimor-LesteTogoTrinidad and TobagoTunisiaTurkeyUgandaUkraineUnited KingdomUnited StatesUpper middle incomeUruguayVanuatuVenezuela, RBVietnamWest Bank and GazaWorldYemen, Rep.ZambiaZimbabwe Linha do tempo:
Nesta escala de tempo está apresentado um gráfico de 1973 ano até 2015 ano OECD members. Dados de 1972 ano ausente. O número de observações reais por data: 43.
Fonte (nome):
Indicadores de desenvolvimento mundial
Fonte (organização):
International Monetary Fund, Government Finance Statistics Yearbook and data files.
Categorias:
Public Sector
Foi atualizado:
23 abr 2017 ano
Indicadores de alterações dos valores ao longo dos anos
Mínimo:
3.71
1 jan 1973 ano
Máximo:
11.441
1 jan 1988 ano
Na data de observação
Valor
Mudança absoluta
A alteração em relação ao valor anterior
1 jan 1973 ano
3.71
+3.71
0.0%
1 jan 1974 ano
3.846
+0.136
3.67%
1 jan 1975 ano
3.794
-0.052
-1.35%
1 jan 1976 ano
3.827
+0.033
0.87%
1 jan 1977 ano
4.459
+0.632
16.51%
1 jan 1978 ano
5.154
+0.695
15.58%
1 jan 1979 ano
5.703
+0.549
10.66%
1 jan 1980 ano
6.585
+0.882
15.47%
1 jan 1981 ano
7.168
+0.583
8.85%
1 jan 1982 ano
7.159
-0.009
-0.12%
1 jan 1983 ano
6.787
-0.372
-5.2%
1 jan 1984 ano
7.123
+0.336
4.95%
1 jan 1985 ano
7.916
+0.793
11.14%
1 jan 1986 ano
9.72
+1.804
22.78%
1 jan 1987 ano
10.624
+0.905
9.31%
1 jan 1988 ano
11.441
+0.817
7.69%
1 jan 1989 ano
11.296
-0.146
-1.27%
1 jan 1990 ano
10.856
-0.44
-3.9%
1 jan 1991 ano
11.125
+0.27
2.49%
1 jan 1992 ano
10.027
-1.098
-9.87%
1 jan 1993 ano
9.573
-0.454
-4.53%
1 jan 1994 ano
9.33
-0.243
-2.53%
1 jan 1995 ano
9.638
+0.307
3.29%
1 jan 1996 ano
10.747
+1.11
11.51%
1 jan 1997 ano
9.729
-1.018
-9.47%
1 jan 1998 ano
9.512
-0.217
-2.23%
1 jan 1999 ano
9.334
-0.178
-1.87%
1 jan 2000 ano
7.799
-1.535
-16.45%
1 jan 2001 ano
7.561
-0.238
-3.05%
1 jan 2002 ano
6.514
-1.047
-13.84%
1 jan 2003 ano
6.051
-0.464
-7.12%
1 jan 2004 ano
5.633
-0.418
-6.91%
1 jan 2005 ano
5.532
-0.1
-1.78%
1 jan 2006 ano
5.498
-0.034
-0.61%
1 jan 2007 ano
5.552
+0.054
0.98%
1 jan 2008 ano
5.694
+0.142
2.56%
1 jan 2009 ano
5.667
-0.027
-0.48%
1 jan 2010 ano
4.755
-0.912
-16.1%
1 jan 2011 ano
5.209
+0.454
9.55%
1 jan 2012 ano
5.835
+0.626
12.02%
1 jan 2013 ano
5.696
-0.139
-2.38%
1 jan 2014 ano
5.727
+0.031
0.55%
1 jan 2015 ano
5.948
+0.221
3.85%
Classificação de países por estatísticas atuais por anos


Comentários: