29
/pt/
pt
AIzaSyAYiBZKx7MnpbEhh9jyipgxe19OcubqV5w
April 1, 2024
256487
Sweden
SWE
true
2
1
Interest payments (% of expense)
2015,2014,2013,2012,2011,2010,2009,2008,2007,2006,2005,2004,2003,2002,2001,2000,1999,1998,1997,1996,1995,1994,1993,1992,1991,1990,1989,1988,1987,1986,1985,1984,1983,1982,1981,1980,1979,1978,1977,1976,1975,1974,1973
Estas estatísticas em outros países:
AfghanistanAlbaniaAlgeriaAngolaAntigua and BarbudaArab WorldArmeniaAustraliaAustriaAzerbaijanBahamas, TheBahrainBangladeshBarbadosBelarusBelgiumBelizeBeninBhutanBoliviaBosnia and HerzegovinaBotswanaBrazilBulgariaBurkina FasoBurundiCabo VerdeCambodiaCanadaCaribbean small statesCentral African RepublicCentral Europe and the BalticsChileColombiaCongo, Dem. Rep.Congo, Rep.Costa RicaCote d'IvoireCroatiaCyprusCzech RepublicDenmarkDominicaDominican RepublicEarly-demographic dividendEast Asia & PacificEast Asia & Pacific (excluding high income)East Asia & Pacific (IDA & IBRD countries)Egypt, Arab Rep.El SalvadorEquatorial GuineaEstoniaEthiopiaEuro areaEurope & Central AsiaEurope & Central Asia (excluding high income)Europe & Central Asia (IDA & IBRD countries)European UnionFijiFinlandFranceGambia, TheGeorgiaGermanyGhanaGreeceGrenadaGuatemalaHeavily indebted poor countries (HIPC)High incomeHondurasHong Kong SAR, ChinaHungaryIBRD onlyIcelandIDA & IBRD totalIDA blendIDA onlyIDA totalIndiaIndonesiaIran, Islamic Rep.IraqIrelandIsraelItalyJamaicaJapanJordanKazakhstanKenyaKiribatiKorea, Rep.KuwaitKyrgyz RepublicLao PDRLate-demographic dividendLatin America & Caribbean Latin America & Caribbean (excluding high income)Latin America & the Caribbean (IDA & IBRD countries)LatviaLeast developed countries: UN classificationLebanonLesothoLiberiaLithuaniaLow & middle incomeLow incomeLower middle incomeLuxembourgMacao SAR, ChinaMacedonia, FYRMadagascarMalawiMalaysiaMaldivesMaliMaltaMauritiusMexicoMicronesia, Fed. Sts.Middle East & North AfricaMiddle East & North Africa (excluding high income)Middle East & North Africa (IDA & IBRD countries)Middle incomeMoldovaMongoliaMoroccoMozambiqueNamibiaNepalNetherlandsNew ZealandNicaraguaNigeriaNorth AmericaNorwayOECD membersOmanOther small statesPakistanPanamaPapua New GuineaParaguayPeruPhilippinesPolandPortugalPost-demographic dividendPre-demographic dividendQatarRomaniaRussian FederationRwandaSamoaSan MarinoSao Tome and PrincipeSenegalSerbiaSeychellesSierra LeoneSingaporeSlovak RepublicSloveniaSmall statesSolomon IslandsSouth AfricaSouth AsiaSouth Asia (IDA & IBRD)SpainSri LankaSt. Kitts and NevisSt. LuciaSub-Saharan Africa Sub-Saharan Africa (excluding high income)Sub-Saharan Africa (IDA & IBRD countries)SurinameSwazilandSwedenSwitzerlandSyrian Arab RepublicTajikistanTanzaniaThailandTimor-LesteTogoTrinidad and TobagoTunisiaTurkeyUgandaUkraineUnited KingdomUnited StatesUpper middle incomeUruguayVanuatuVenezuela, RBVietnamWest Bank and GazaWorldYemen, Rep.ZambiaZimbabwe Linha do tempo:
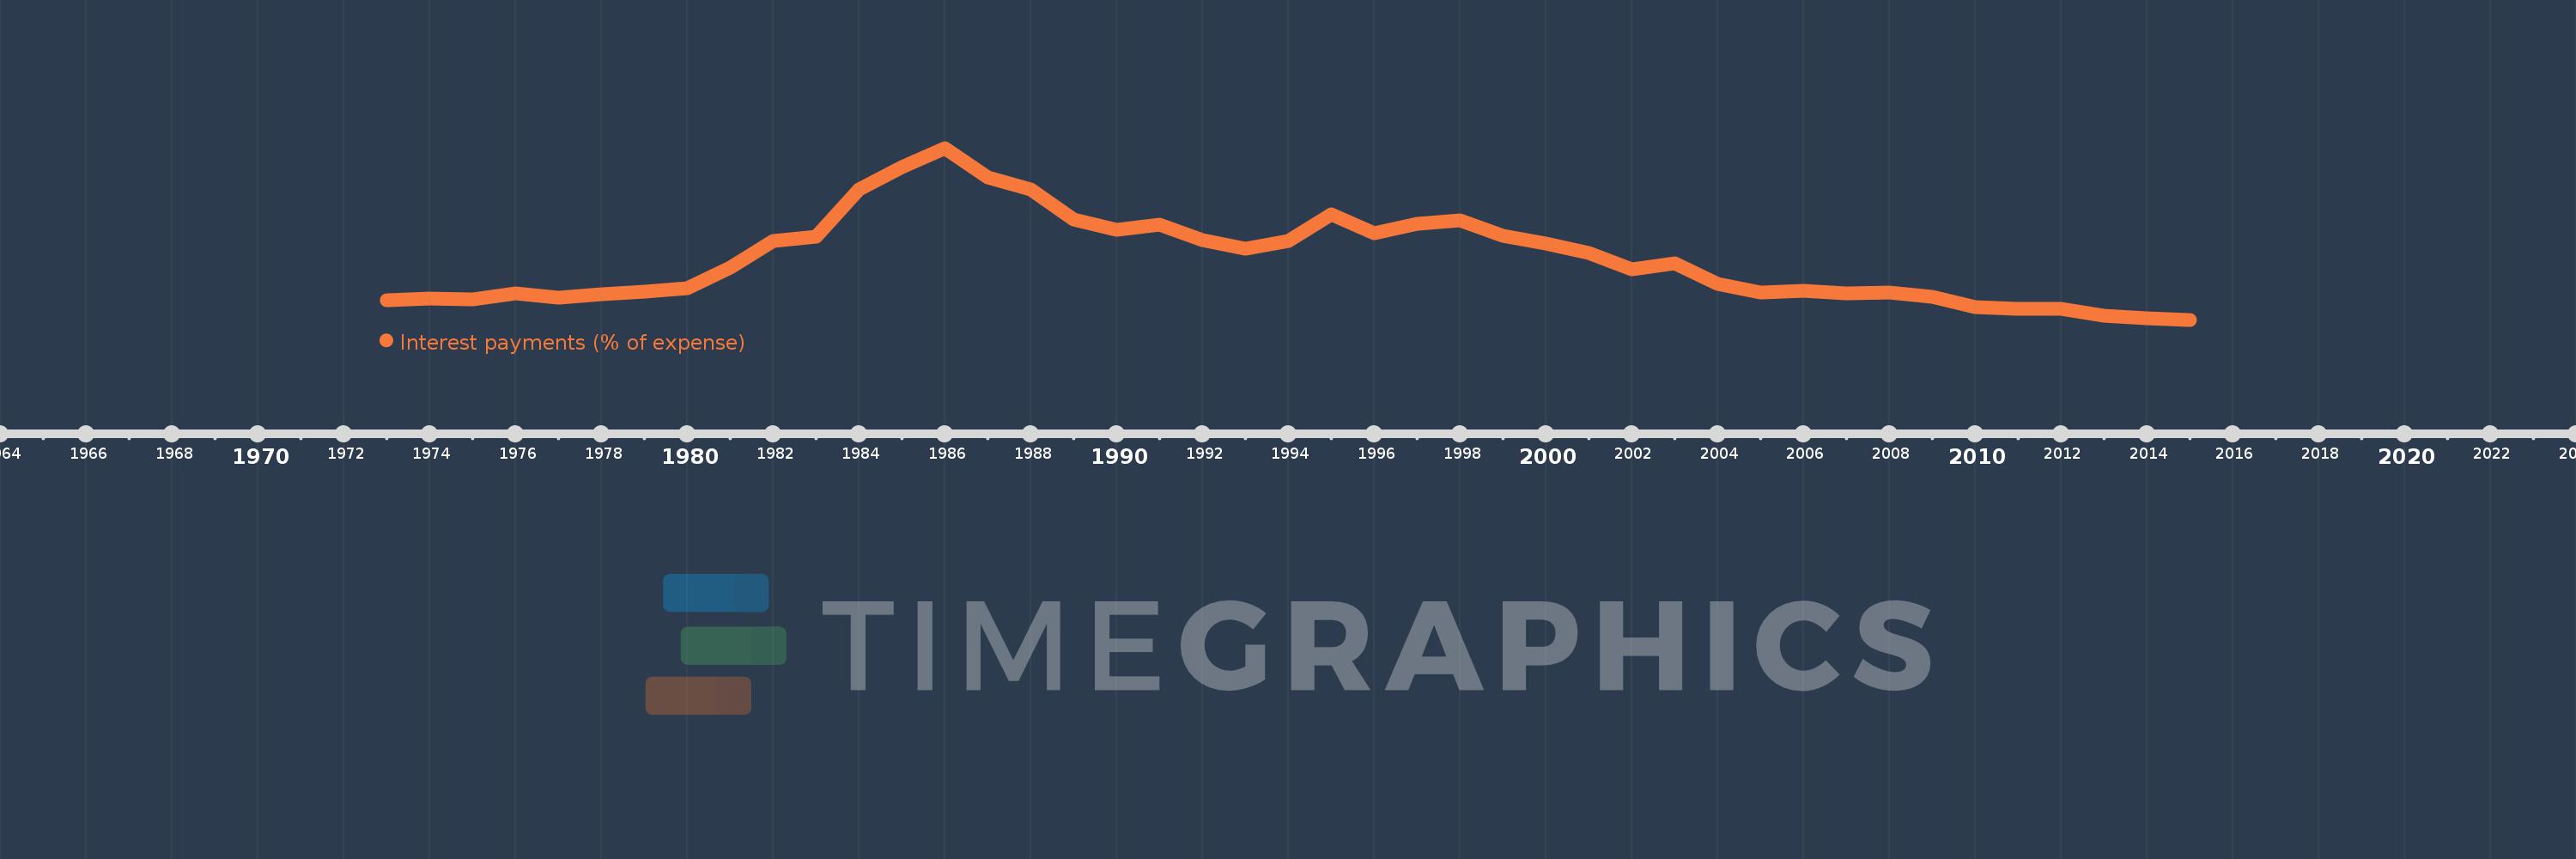
Nesta escala de tempo está apresentado um gráfico de 1973 ano até 2015 ano Sweden. Dados de 1972 ano ausente. O número de observações reais por data: 43.
Fonte (nome):
Indicadores de desenvolvimento mundial
Fonte (organização):
International Monetary Fund, Government Finance Statistics Yearbook and data files.
Categorias:
Public Sector
Foi atualizado:
23 abr 2017 ano
Indicadores de alterações dos valores ao longo dos anos
Mínimo:
1.646
1 jan 2015 ano
Máximo:
19.744
1 jan 1986 ano
Na data de observação
Valor
Mudança absoluta
A alteração em relação ao valor anterior
1 jan 1973 ano
3.71
+3.71
0.0%
1 jan 1974 ano
3.846
+0.136
3.67%
1 jan 1975 ano
3.812
-0.034
-0.89%
1 jan 1976 ano
4.431
+0.619
16.25%
1 jan 1977 ano
3.982
-0.449
-10.14%
1 jan 1978 ano
4.309
+0.328
8.23%
1 jan 1979 ano
4.6
+0.29
6.74%
1 jan 1980 ano
4.97
+0.37
8.04%
1 jan 1981 ano
7.168
+2.198
44.24%
1 jan 1982 ano
9.931
+2.763
38.55%
1 jan 1983 ano
10.397
+0.466
4.69%
1 jan 1984 ano
15.392
+4.995
48.04%
1 jan 1985 ano
17.741
+2.349
15.26%
1 jan 1986 ano
19.744
+2.002
11.29%
1 jan 1987 ano
16.624
-3.12
-15.8%
1 jan 1988 ano
15.386
-1.238
-7.45%
1 jan 1989 ano
12.195
-3.191
-20.74%
1 jan 1990 ano
11.136
-1.059
-8.68%
1 jan 1991 ano
11.685
+0.549
4.93%
1 jan 1992 ano
10.047
-1.638
-14.02%
1 jan 1993 ano
9.132
-0.915
-9.11%
1 jan 1994 ano
9.973
+0.841
9.21%
1 jan 1995 ano
12.78
+2.807
28.15%
1 jan 1996 ano
10.747
-2.033
-15.91%
1 jan 1997 ano
11.719
+0.972
9.04%
1 jan 1998 ano
12.107
+0.387
3.31%
1 jan 1999 ano
10.495
-1.611
-13.31%
1 jan 2000 ano
9.647
-0.848
-8.08%
1 jan 2001 ano
8.679
-0.969
-10.04%
1 jan 2002 ano
6.924
-1.754
-20.21%
1 jan 2003 ano
7.608
+0.684
9.87%
1 jan 2004 ano
5.412
-2.196
-28.86%
1 jan 2005 ano
4.532
-0.88
-16.26%
1 jan 2006 ano
4.714
+0.181
4.0%
1 jan 2007 ano
4.468
-0.246
-5.22%
1 jan 2008 ano
4.52
+0.053
1.18%
1 jan 2009 ano
4.068
-0.453
-10.01%
1 jan 2010 ano
2.949
-1.119
-27.5%
1 jan 2011 ano
2.759
-0.19
-6.44%
1 jan 2012 ano
2.797
+0.038
1.37%
1 jan 2013 ano
2.032
-0.765
-27.36%
1 jan 2014 ano
1.84
-0.192
-9.46%
1 jan 2015 ano
1.646
-0.193
-10.51%
Classificação de países por estatísticas atuais por anos


Comentários: