29
/pt/
pt
AIzaSyAYiBZKx7MnpbEhh9jyipgxe19OcubqV5w
April 1, 2024
191544
Malta
MLT
true
2
1
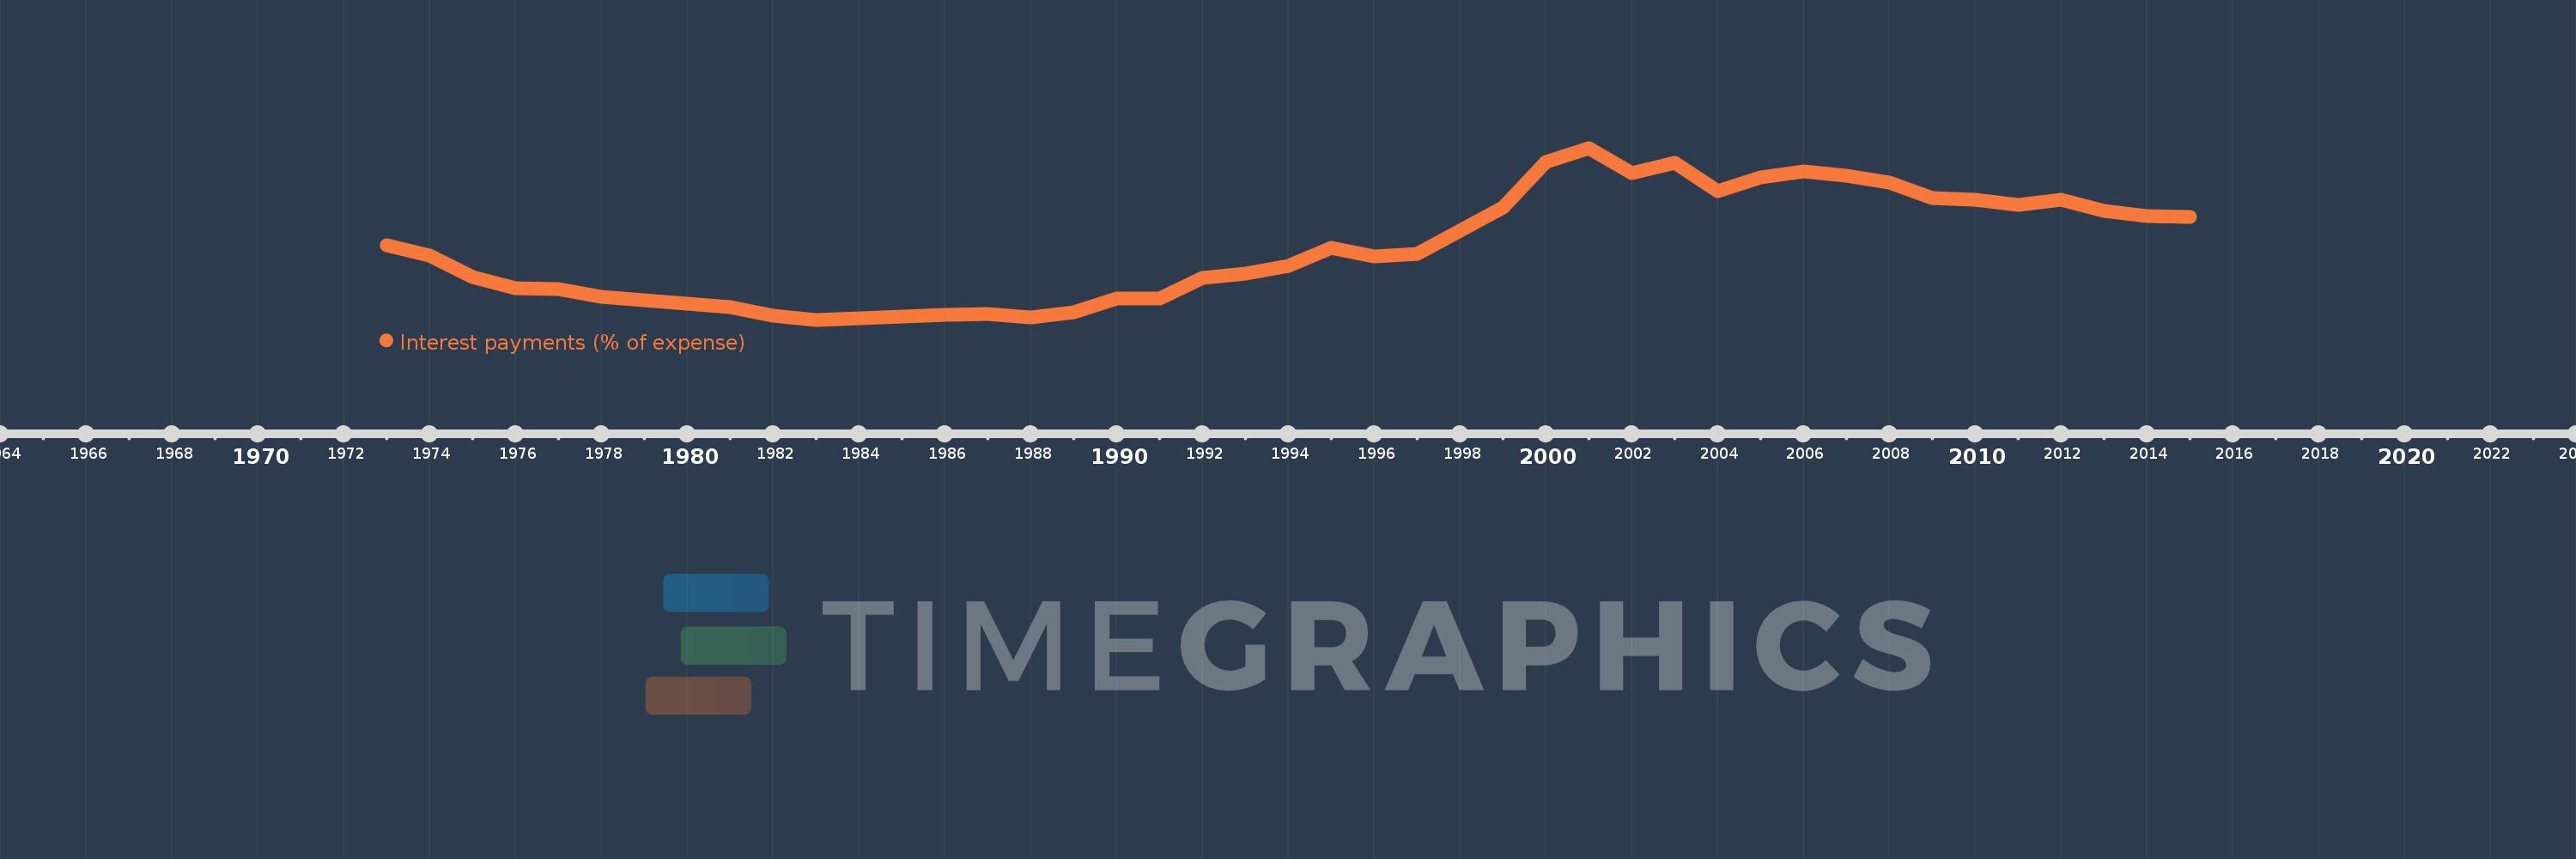
Interest payments (% of expense)
2015,2014,2013,2012,2011,2010,2009,2008,2007,2006,2005,2004,2003,2002,2001,2000,1999,1998,1997,1996,1995,1994,1993,1992,1991,1990,1989,1988,1987,1986,1985,1984,1983,1982,1981,1979,1978,1977,1976,1975,1974,1973
Estas estatísticas em outros países:
AfghanistanAlbaniaAlgeriaAngolaAntigua and BarbudaArab WorldArmeniaAustraliaAustriaAzerbaijanBahamas, TheBahrainBangladeshBarbadosBelarusBelgiumBelizeBeninBhutanBoliviaBosnia and HerzegovinaBotswanaBrazilBulgariaBurkina FasoBurundiCabo VerdeCambodiaCanadaCaribbean small statesCentral African RepublicCentral Europe and the BalticsChileColombiaCongo, Dem. Rep.Congo, Rep.Costa RicaCote d'IvoireCroatiaCyprusCzech RepublicDenmarkDominicaDominican RepublicEarly-demographic dividendEast Asia & PacificEast Asia & Pacific (excluding high income)East Asia & Pacific (IDA & IBRD countries)Egypt, Arab Rep.El SalvadorEquatorial GuineaEstoniaEthiopiaEuro areaEurope & Central AsiaEurope & Central Asia (excluding high income)Europe & Central Asia (IDA & IBRD countries)European UnionFijiFinlandFranceGambia, TheGeorgiaGermanyGhanaGreeceGrenadaGuatemalaHeavily indebted poor countries (HIPC)High incomeHondurasHong Kong SAR, ChinaHungaryIBRD onlyIcelandIDA & IBRD totalIDA blendIDA onlyIDA totalIndiaIndonesiaIran, Islamic Rep.IraqIrelandIsraelItalyJamaicaJapanJordanKazakhstanKenyaKiribatiKorea, Rep.KuwaitKyrgyz RepublicLao PDRLate-demographic dividendLatin America & Caribbean Latin America & Caribbean (excluding high income)Latin America & the Caribbean (IDA & IBRD countries)LatviaLeast developed countries: UN classificationLebanonLesothoLiberiaLithuaniaLow & middle incomeLow incomeLower middle incomeLuxembourgMacao SAR, ChinaMacedonia, FYRMadagascarMalawiMalaysiaMaldivesMaliMaltaMauritiusMexicoMicronesia, Fed. Sts.Middle East & North AfricaMiddle East & North Africa (excluding high income)Middle East & North Africa (IDA & IBRD countries)Middle incomeMoldovaMongoliaMoroccoMozambiqueNamibiaNepalNetherlandsNew ZealandNicaraguaNigeriaNorth AmericaNorwayOECD membersOmanOther small statesPakistanPanamaPapua New GuineaParaguayPeruPhilippinesPolandPortugalPost-demographic dividendPre-demographic dividendQatarRomaniaRussian FederationRwandaSamoaSan MarinoSao Tome and PrincipeSenegalSerbiaSeychellesSierra LeoneSingaporeSlovak RepublicSloveniaSmall statesSolomon IslandsSouth AfricaSouth AsiaSouth Asia (IDA & IBRD)SpainSri LankaSt. Kitts and NevisSt. LuciaSub-Saharan Africa Sub-Saharan Africa (excluding high income)Sub-Saharan Africa (IDA & IBRD countries)SurinameSwazilandSwedenSwitzerlandSyrian Arab RepublicTajikistanTanzaniaThailandTimor-LesteTogoTrinidad and TobagoTunisiaTurkeyUgandaUkraineUnited KingdomUnited StatesUpper middle incomeUruguayVanuatuVenezuela, RBVietnamWest Bank and GazaWorldYemen, Rep.ZambiaZimbabwe Linha do tempo:
Nesta escala de tempo está apresentado um gráfico de 1973 ano até 2015 ano Malta. Dados de 1972 ano ausente. O número de observações reais por data: 42.
Fonte (nome):
Indicadores de desenvolvimento mundial
Fonte (organização):
International Monetary Fund, Government Finance Statistics Yearbook and data files.
Categorias:
Public Sector
Foi atualizado:
23 abr 2017 ano
Indicadores de alterações dos valores ao longo dos anos
Mínimo:
1.333
1 jan 1983 ano
Máximo:
10.611
1 jan 2001 ano
Na data de observação
Valor
Mudança absoluta
A alteração em relação ao valor anterior
1 jan 1973 ano
5.352
+5.352
0.0%
1 jan 1974 ano
4.787
-0.564
-10.55%
1 jan 1975 ano
3.619
-1.169
-24.41%
1 jan 1976 ano
3.036
-0.583
-16.12%
1 jan 1977 ano
3.005
-0.031
-1.02%
1 jan 1978 ano
2.576
-0.428
-14.25%
1 jan 1979 ano
2.374
-0.202
-7.85%
1 jan 1981 ano
2.008
-0.366
-15.42%
1 jan 1982 ano
1.552
-0.456
-22.73%
1 jan 1983 ano
1.333
-0.218
-14.07%
1 jan 1984 ano
1.406
+0.073
5.49%
1 jan 1985 ano
1.517
+0.11
7.84%
1 jan 1986 ano
1.581
+0.065
4.25%
1 jan 1987 ano
1.621
+0.039
2.49%
1 jan 1988 ano
1.449
-0.172
-10.58%
1 jan 1989 ano
1.748
+0.299
20.65%
1 jan 1990 ano
2.495
+0.747
42.71%
1 jan 1991 ano
2.457
-0.038
-1.53%
1 jan 1992 ano
3.615
+1.158
47.12%
1 jan 1993 ano
3.829
+0.215
5.94%
1 jan 1994 ano
4.227
+0.398
10.38%
1 jan 1995 ano
5.203
+0.976
23.09%
1 jan 1996 ano
4.74
-0.463
-8.9%
1 jan 1997 ano
4.902
+0.163
3.43%
1 jan 1998 ano
6.129
+1.226
25.01%
1 jan 1999 ano
7.414
+1.285
20.97%
1 jan 2000 ano
9.856
+2.442
32.94%
1 jan 2001 ano
10.611
+0.755
7.66%
1 jan 2002 ano
9.265
-1.346
-12.69%
1 jan 2003 ano
9.8
+0.535
5.78%
1 jan 2004 ano
8.297
-1.502
-15.33%
1 jan 2005 ano
9.011
+0.713
8.6%
1 jan 2006 ano
9.355
+0.344
3.82%
1 jan 2007 ano
9.13
-0.225
-2.41%
1 jan 2008 ano
8.724
-0.406
-4.44%
1 jan 2009 ano
7.901
-0.823
-9.43%
1 jan 2010 ano
7.814
-0.087
-1.1%
1 jan 2011 ano
7.515
-0.3
-3.83%
1 jan 2012 ano
7.803
+0.288
3.83%
1 jan 2013 ano
7.227
-0.576
-7.38%
1 jan 2014 ano
6.946
-0.281
-3.89%
1 jan 2015 ano
6.873
-0.073
-1.05%
Classificação de países por estatísticas atuais por anos


Comentários: