29
/pt/
pt
AIzaSyAYiBZKx7MnpbEhh9jyipgxe19OcubqV5w
April 1, 2024
124958
Egypt, Arab Rep.
EGY
true
2
1
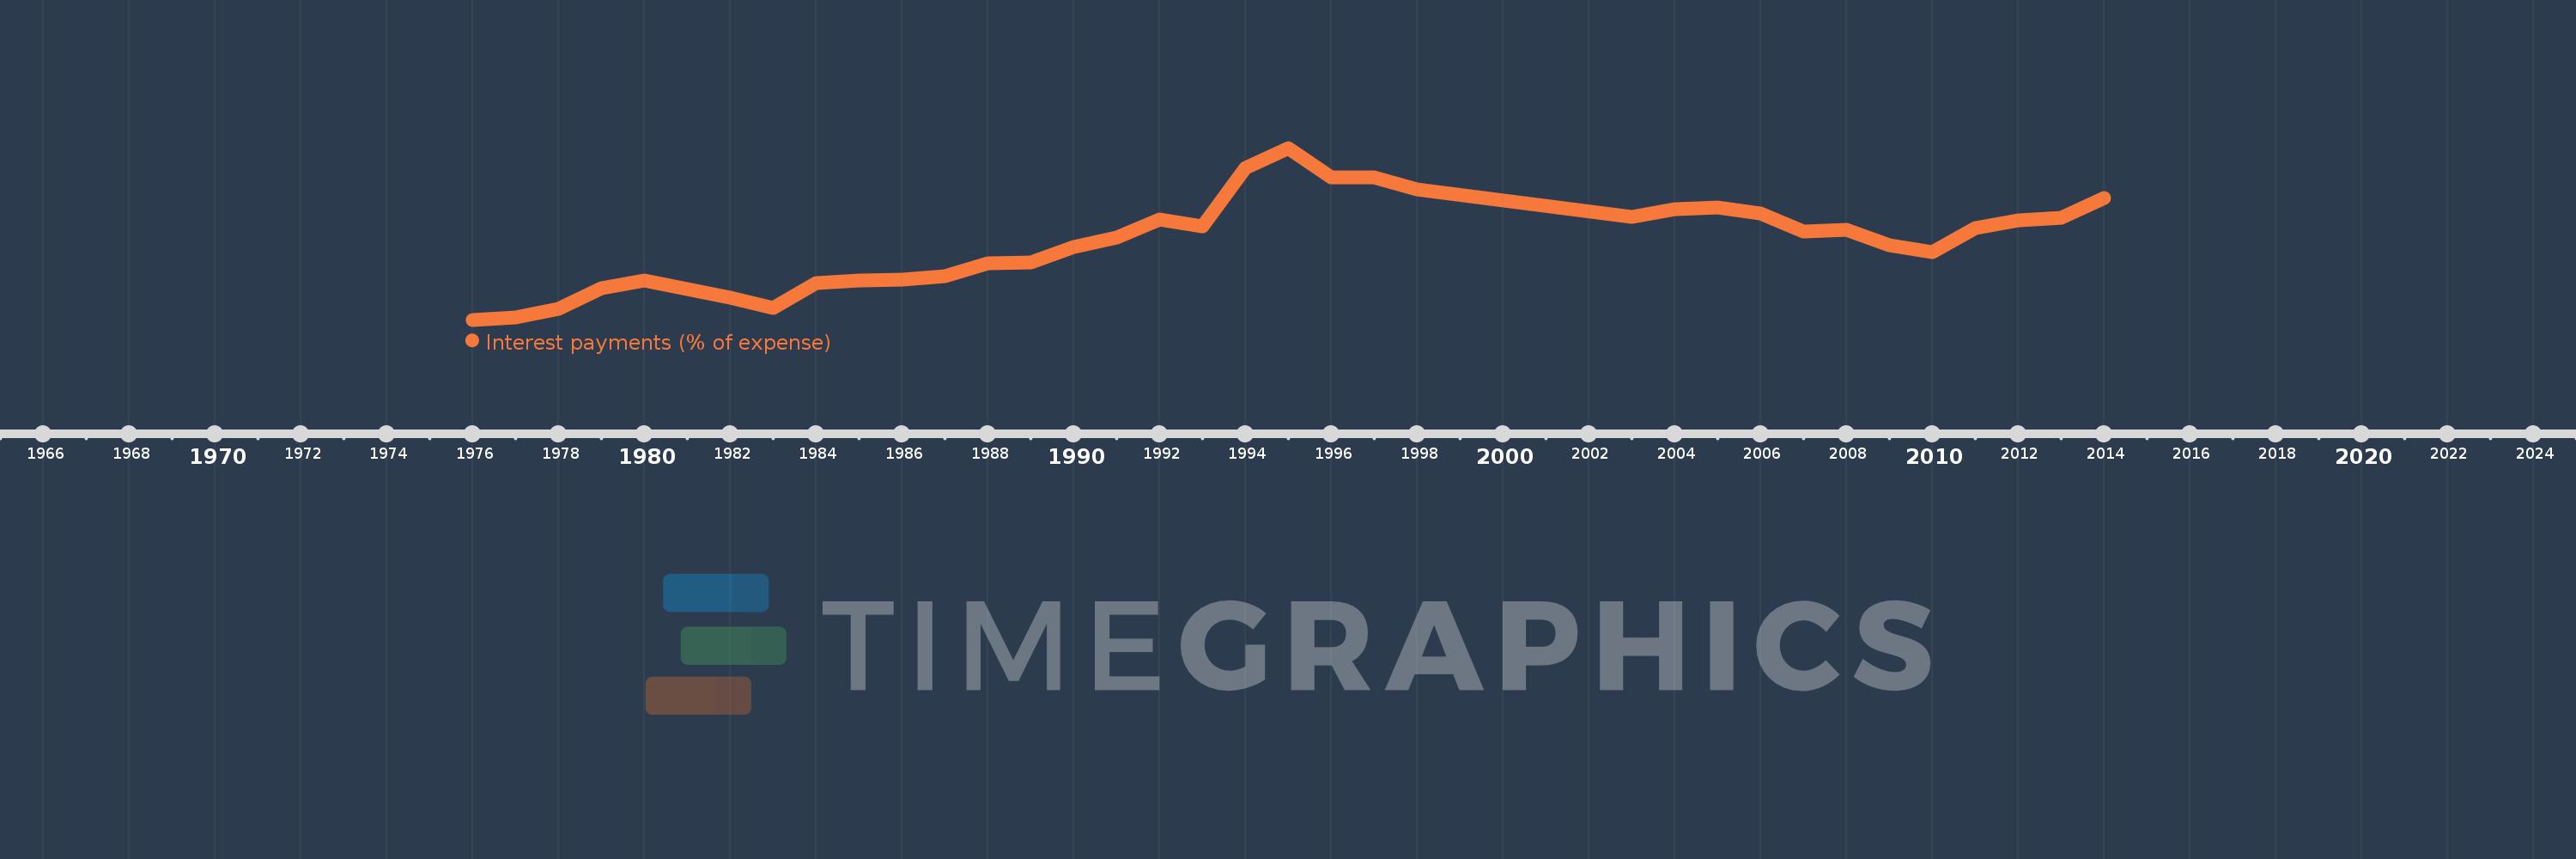
Interest payments (% of expense)
2014,2013,2012,2011,2010,2009,2008,2007,2006,2005,2004,2003,1998,1997,1996,1995,1994,1993,1992,1991,1990,1989,1988,1987,1986,1985,1984,1983,1982,1980,1979,1978,1977,1976
Estas estatísticas em outros países:
AfghanistanAlbaniaAlgeriaAngolaAntigua and BarbudaArab WorldArmeniaAustraliaAustriaAzerbaijanBahamas, TheBahrainBangladeshBarbadosBelarusBelgiumBelizeBeninBhutanBoliviaBosnia and HerzegovinaBotswanaBrazilBulgariaBurkina FasoBurundiCabo VerdeCambodiaCanadaCaribbean small statesCentral African RepublicCentral Europe and the BalticsChileColombiaCongo, Dem. Rep.Congo, Rep.Costa RicaCote d'IvoireCroatiaCyprusCzech RepublicDenmarkDominicaDominican RepublicEarly-demographic dividendEast Asia & PacificEast Asia & Pacific (excluding high income)East Asia & Pacific (IDA & IBRD countries)Egypt, Arab Rep.El SalvadorEquatorial GuineaEstoniaEthiopiaEuro areaEurope & Central AsiaEurope & Central Asia (excluding high income)Europe & Central Asia (IDA & IBRD countries)European UnionFijiFinlandFranceGambia, TheGeorgiaGermanyGhanaGreeceGrenadaGuatemalaHeavily indebted poor countries (HIPC)High incomeHondurasHong Kong SAR, ChinaHungaryIBRD onlyIcelandIDA & IBRD totalIDA blendIDA onlyIDA totalIndiaIndonesiaIran, Islamic Rep.IraqIrelandIsraelItalyJamaicaJapanJordanKazakhstanKenyaKiribatiKorea, Rep.KuwaitKyrgyz RepublicLao PDRLate-demographic dividendLatin America & Caribbean Latin America & Caribbean (excluding high income)Latin America & the Caribbean (IDA & IBRD countries)LatviaLeast developed countries: UN classificationLebanonLesothoLiberiaLithuaniaLow & middle incomeLow incomeLower middle incomeLuxembourgMacao SAR, ChinaMacedonia, FYRMadagascarMalawiMalaysiaMaldivesMaliMaltaMauritiusMexicoMicronesia, Fed. Sts.Middle East & North AfricaMiddle East & North Africa (excluding high income)Middle East & North Africa (IDA & IBRD countries)Middle incomeMoldovaMongoliaMoroccoMozambiqueNamibiaNepalNetherlandsNew ZealandNicaraguaNigeriaNorth AmericaNorwayOECD membersOmanOther small statesPakistanPanamaPapua New GuineaParaguayPeruPhilippinesPolandPortugalPost-demographic dividendPre-demographic dividendQatarRomaniaRussian FederationRwandaSamoaSan MarinoSao Tome and PrincipeSenegalSerbiaSeychellesSierra LeoneSingaporeSlovak RepublicSloveniaSmall statesSolomon IslandsSouth AfricaSouth AsiaSouth Asia (IDA & IBRD)SpainSri LankaSt. Kitts and NevisSt. LuciaSub-Saharan Africa Sub-Saharan Africa (excluding high income)Sub-Saharan Africa (IDA & IBRD countries)SurinameSwazilandSwedenSwitzerlandSyrian Arab RepublicTajikistanTanzaniaThailandTimor-LesteTogoTrinidad and TobagoTunisiaTurkeyUgandaUkraineUnited KingdomUnited StatesUpper middle incomeUruguayVanuatuVenezuela, RBVietnamWest Bank and GazaWorldYemen, Rep.ZambiaZimbabwe Linha do tempo:
Nesta escala de tempo está apresentado um gráfico de 1976 ano até 2014 ano Egypt, Arab Rep.. Dados de 1975 ano ausente. O número de observações reais por data: 34.
Fonte (nome):
Indicadores de desenvolvimento mundial
Fonte (organização):
International Monetary Fund, Government Finance Statistics Yearbook and data files.
Categorias:
Public Sector
Foi atualizado:
23 abr 2017 ano
Indicadores de alterações dos valores ao longo dos anos
Mínimo:
3.081
1 jan 1976 ano
Máximo:
30.693
1 jan 1995 ano
Na data de observação
Valor
Mudança absoluta
A alteração em relação ao valor anterior
1 jan 1976 ano
3.081
+3.081
0.0%
1 jan 1977 ano
3.409
+0.329
10.66%
1 jan 1978 ano
4.851
+1.441
42.27%
1 jan 1979 ano
8.092
+3.241
66.82%
1 jan 1980 ano
9.404
+1.312
16.21%
1 jan 1982 ano
6.643
-2.761
-29.36%
1 jan 1983 ano
4.956
-1.687
-25.4%
1 jan 1984 ano
8.94
+3.984
80.39%
1 jan 1985 ano
9.405
+0.466
5.21%
1 jan 1986 ano
9.522
+0.117
1.24%
1 jan 1987 ano
10.094
+0.572
6.0%
1 jan 1988 ano
12.147
+2.053
20.33%
1 jan 1989 ano
12.26
+0.113
0.93%
1 jan 1990 ano
14.733
+2.474
20.18%
1 jan 1991 ano
16.276
+1.543
10.47%
1 jan 1992 ano
19.136
+2.86
17.57%
1 jan 1993 ano
18.08
-1.057
-5.52%
1 jan 1994 ano
27.491
+9.411
52.05%
1 jan 1995 ano
30.693
+3.203
11.65%
1 jan 1996 ano
26.022
-4.671
-15.22%
1 jan 1997 ano
25.934
-0.088
-0.34%
1 jan 1998 ano
23.986
-1.948
-7.51%
1 jan 2003 ano
19.665
-4.321
-18.01%
1 jan 2004 ano
20.793
+1.127
5.73%
1 jan 2005 ano
21.086
+0.293
1.41%
1 jan 2006 ano
20.209
-0.877
-4.16%
1 jan 2007 ano
17.201
-3.008
-14.88%
1 jan 2008 ano
17.56
+0.359
2.09%
1 jan 2009 ano
15.085
-2.475
-14.09%
1 jan 2010 ano
13.959
-1.127
-7.47%
1 jan 2011 ano
17.862
+3.903
27.96%
1 jan 2012 ano
19.08
+1.218
6.82%
1 jan 2013 ano
19.44
+0.36
1.89%
1 jan 2014 ano
22.59
+3.15
16.2%
Classificação de países por estatísticas atuais por anos


Comentários: