29
/pt/
pt
AIzaSyAYiBZKx7MnpbEhh9jyipgxe19OcubqV5w
April 1, 2024
52525
OECD members
OED
false
2
1
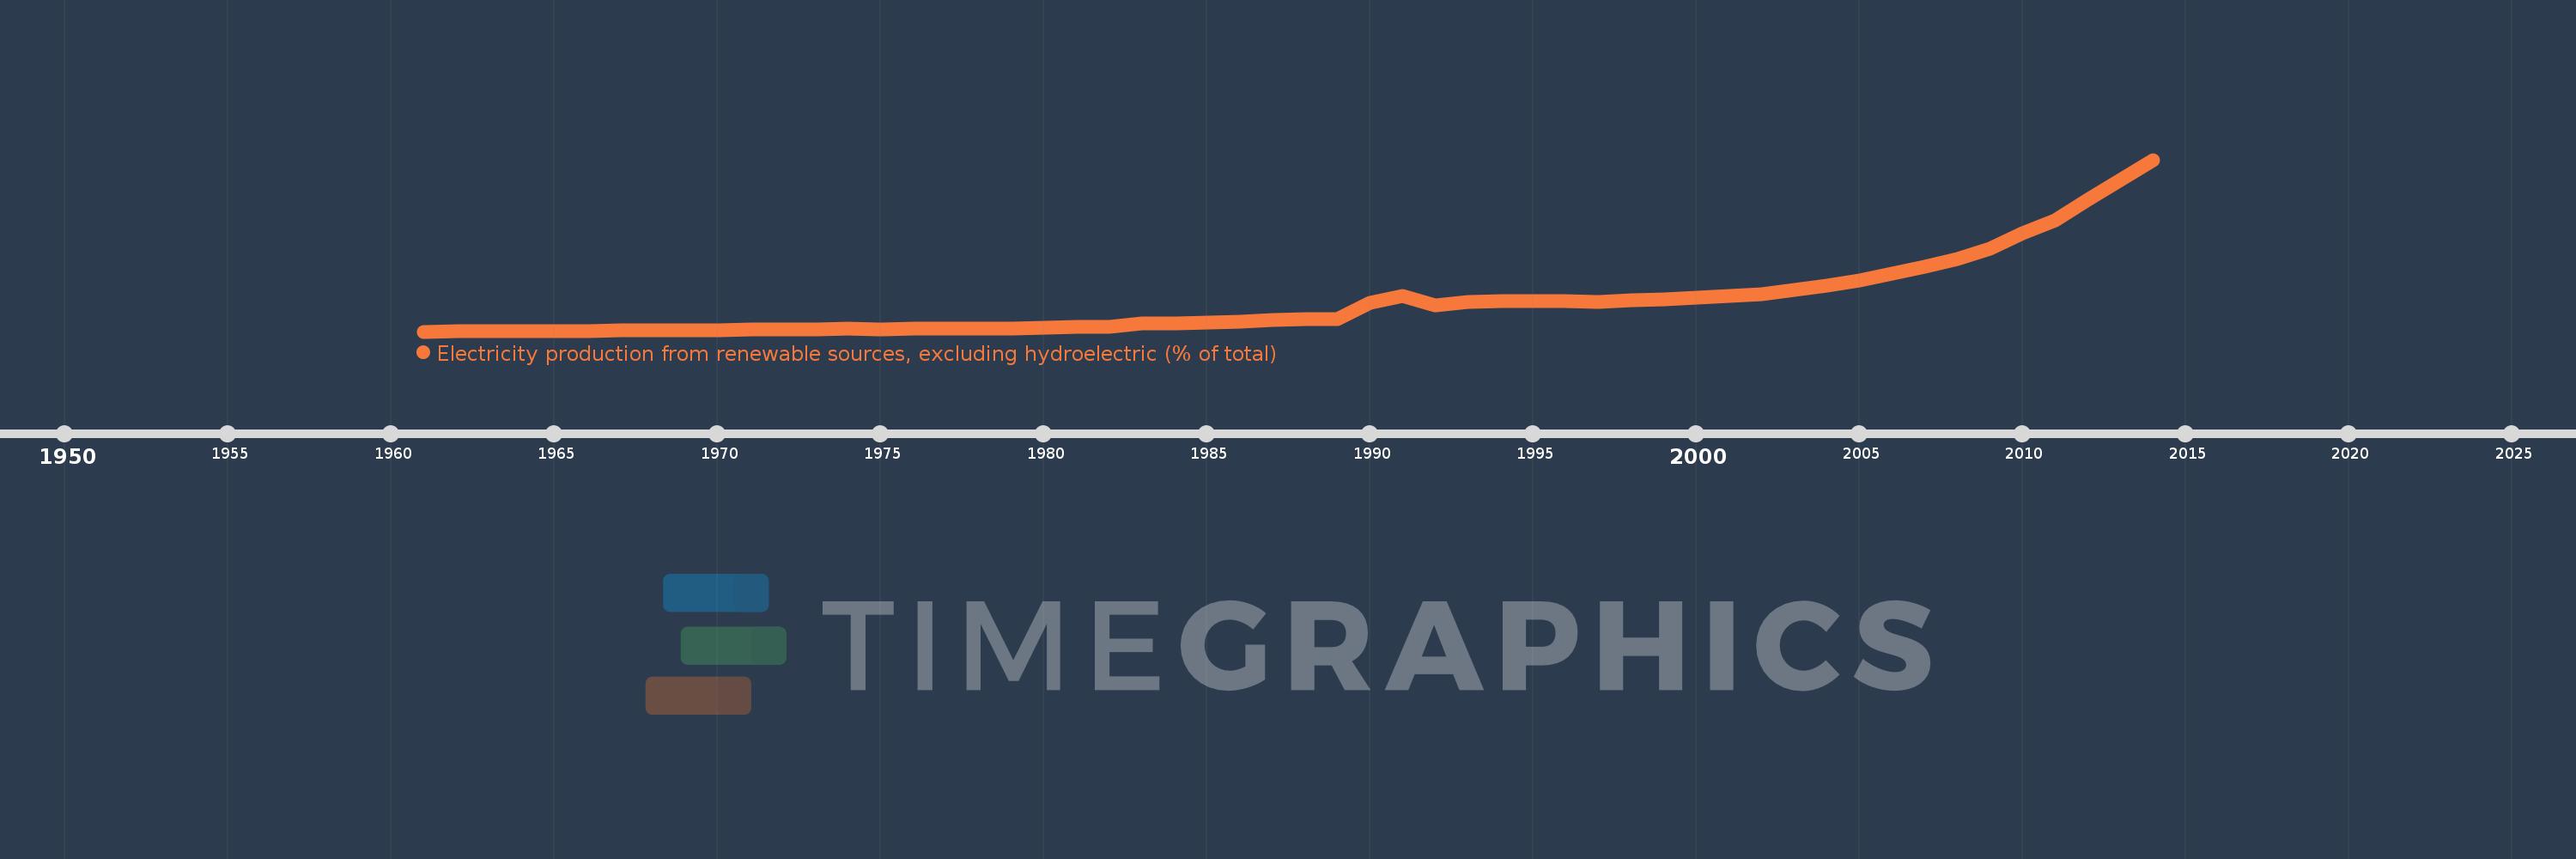
Electricity production from renewable sources, excluding hydroelectric (% of total)
2014,2013,2012,2011,2010,2009,2008,2007,2006,2005,2004,2003,2002,2001,2000,1999,1998,1997,1996,1995,1994,1993,1992,1991,1990,1989,1988,1987,1986,1985,1984,1983,1982,1981,1980,1979,1978,1977,1976,1975,1974,1973,1972,1971,1970,1969,1968,1967,1966,1965,1964,1963,1962,1961
Estas estatísticas em outros países:
AlbaniaAlgeriaAngolaArab WorldArgentinaArmeniaAustraliaAustriaAzerbaijanBahrainBangladeshBelarusBelgiumBeninBoliviaBosnia and HerzegovinaBotswanaBrazilBrunei DarussalamBulgariaCambodiaCameroonCanadaCentral Europe and the BalticsChileChinaColombiaCongo, Dem. Rep.Congo, Rep.Costa RicaCote d'IvoireCroatiaCubaCuracaoCyprusCzech RepublicDenmarkDominican RepublicEarly-demographic dividendEast Asia & PacificEast Asia & Pacific (excluding high income)East Asia & Pacific (IDA & IBRD countries)EcuadorEgypt, Arab Rep.El SalvadorEritreaEstoniaEthiopiaEuro areaEurope & Central AsiaEurope & Central Asia (excluding high income)Europe & Central Asia (IDA & IBRD countries)European UnionFinlandFragile and conflict affected situationsFranceGabonGeorgiaGermanyGhanaGibraltarGreeceGuatemalaHaitiHeavily indebted poor countries (HIPC)High incomeHondurasHong Kong SAR, ChinaHungaryIBRD onlyIcelandIDA & IBRD totalIDA blendIDA onlyIDA totalIndiaIndonesiaIran, Islamic Rep.IraqIrelandIsraelItalyJamaicaJapanJordanKazakhstanKenyaKorea, Dem. People’s Rep.Korea, Rep.KosovoKuwaitKyrgyz RepublicLate-demographic dividendLatin America & Caribbean Latin America & Caribbean (excluding high income)Latin America & the Caribbean (IDA & IBRD countries)LatviaLeast developed countries: UN classificationLebanonLibyaLithuaniaLow & middle incomeLower middle incomeLuxembourgMacedonia, FYRMalaysiaMaltaMauritiusMexicoMiddle East & North AfricaMiddle East & North Africa (excluding high income)Middle East & North Africa (IDA & IBRD countries)Middle incomeMoldovaMongoliaMontenegroMoroccoMozambiqueMyanmarNamibiaNepalNetherlandsNew ZealandNicaraguaNigerNigeriaNorth AmericaNorwayOECD membersOmanOther small statesPakistanPanamaParaguayPeruPhilippinesPolandPortugalPost-demographic dividendPre-demographic dividendQatarRomaniaRussian FederationSaudi ArabiaSenegalSerbiaSingaporeSlovak RepublicSloveniaSmall statesSouth AfricaSouth AsiaSouth Asia (IDA & IBRD)South SudanSpainSri LankaSub-Saharan Africa Sub-Saharan Africa (excluding high income)Sub-Saharan Africa (IDA & IBRD countries)SudanSwedenSwitzerlandSyrian Arab RepublicTajikistanTanzaniaThailandTogoTrinidad and TobagoTunisiaTurkeyTurkmenistanUkraineUnited Arab EmiratesUnited KingdomUnited StatesUpper middle incomeUruguayUzbekistanVenezuela, RBVietnamWorldYemen, Rep.ZambiaZimbabwe Linha do tempo:
Nesta escala de tempo está apresentado um gráfico de 1961 ano até 2014 ano OECD members. Dados de 1960 ano ausente. O número de observações reais por data: 54.
Fonte (nome):
Indicadores de desenvolvimento mundial
Fonte (organização):
IEA Statistics © OECD/IEA 2014 (http://www.iea.org/stats/index.asp), subject to https://www.iea.org/t&c/termsandconditions/
Categorias:
Energy & Mining, Climate Change, Environment
Foi atualizado:
23 abr 2017 ano
Indicadores de alterações dos valores ao longo dos anos
Mínimo:
0.177
1 jan 1961 ano
Máximo:
8.182
1 jan 2014 ano
Na data de observação
Valor
Mudança absoluta
A alteração em relação ao valor anterior
1 jan 1961 ano
0.177
+0.177
0.0%
1 jan 1962 ano
0.188
+0.011
6.16%
1 jan 1963 ano
0.193
+0.006
2.98%
1 jan 1964 ano
0.206
+0.013
6.61%
1 jan 1965 ano
0.203
-0.003
-1.39%
1 jan 1966 ano
0.203
+0.0
0.11%
1 jan 1967 ano
0.231
+0.028
13.77%
1 jan 1968 ano
0.227
-0.005
-2.0%
1 jan 1969 ano
0.235
+0.008
3.45%
1 jan 1970 ano
0.234
-0.001
-0.25%
1 jan 1971 ano
0.291
+0.057
24.21%
1 jan 1972 ano
0.285
-0.006
-2.0%
1 jan 1973 ano
0.284
-0.001
-0.29%
1 jan 1974 ano
0.307
+0.023
8.0%
1 jan 1975 ano
0.284
-0.023
-7.38%
1 jan 1976 ano
0.311
+0.026
9.3%
1 jan 1977 ano
0.317
+0.006
2.05%
1 jan 1978 ano
0.322
+0.005
1.65%
1 jan 1979 ano
0.31
-0.012
-3.76%
1 jan 1980 ano
0.34
+0.03
9.71%
1 jan 1981 ano
0.388
+0.048
14.18%
1 jan 1982 ano
0.413
+0.025
6.43%
1 jan 1983 ano
0.543
+0.13
31.36%
1 jan 1984 ano
0.573
+0.03
5.55%
1 jan 1985 ano
0.611
+0.038
6.56%
1 jan 1986 ano
0.651
+0.04
6.58%
1 jan 1987 ano
0.72
+0.069
10.63%
1 jan 1988 ano
0.738
+0.017
2.43%
1 jan 1989 ano
0.743
+0.006
0.76%
1 jan 1990 ano
1.524
+0.781
105.07%
1 jan 1991 ano
1.846
+0.322
21.12%
1 jan 1992 ano
1.412
-0.434
-23.5%
1 jan 1993 ano
1.551
+0.138
9.8%
1 jan 1994 ano
1.584
+0.034
2.16%
1 jan 1995 ano
1.604
+0.02
1.25%
1 jan 1996 ano
1.587
-0.017
-1.05%
1 jan 1997 ano
1.577
-0.011
-0.68%
1 jan 1998 ano
1.634
+0.058
3.65%
1 jan 1999 ano
1.679
+0.045
2.73%
1 jan 2000 ano
1.756
+0.078
4.63%
1 jan 2001 ano
1.855
+0.098
5.58%
1 jan 2002 ano
1.923
+0.069
3.71%
1 jan 2003 ano
2.133
+0.209
10.88%
1 jan 2004 ano
2.314
+0.181
8.5%
1 jan 2005 ano
2.575
+0.262
11.31%
1 jan 2006 ano
2.883
+0.307
11.93%
1 jan 2007 ano
3.183
+0.301
10.43%
1 jan 2008 ano
3.572
+0.388
12.2%
1 jan 2009 ano
4.059
+0.487
13.64%
1 jan 2010 ano
4.75
+0.691
17.02%
1 jan 2011 ano
5.363
+0.614
12.92%
1 jan 2012 ano
6.333
+0.97
18.09%
1 jan 2013 ano
7.246
+0.913
14.41%
1 jan 2014 ano
8.182
+0.936
12.92%
Classificação de países por estatísticas atuais por anos


Comentários: