29
/pt/
pt
AIzaSyAYiBZKx7MnpbEhh9jyipgxe19OcubqV5w
April 1, 2024
161367
Italy
ITA
true
2
1
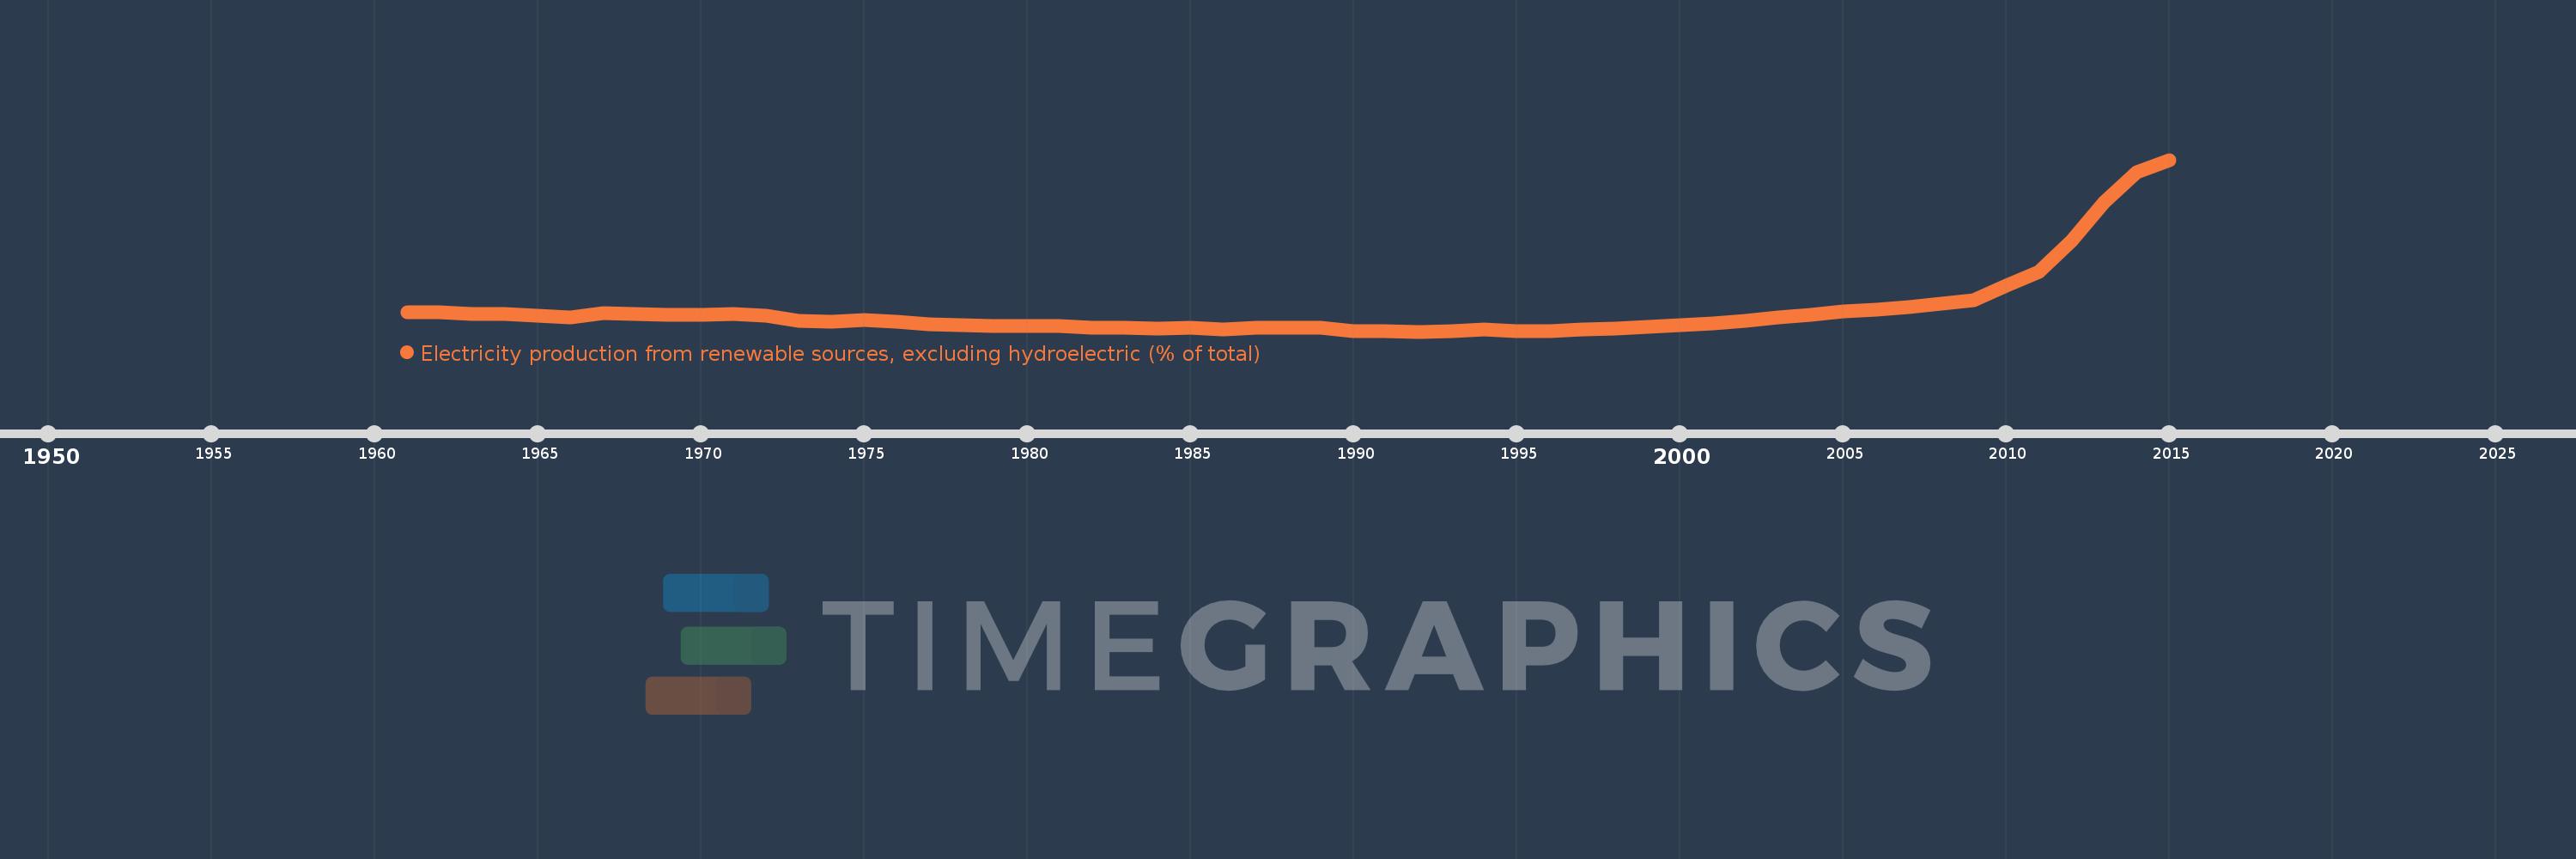
Electricity production from renewable sources, excluding hydroelectric (% of total)
2015,2014,2013,2012,2011,2010,2009,2008,2007,2006,2005,2004,2003,2002,2001,2000,1999,1998,1997,1996,1995,1994,1993,1992,1991,1990,1989,1988,1987,1986,1985,1984,1983,1982,1981,1980,1979,1978,1977,1976,1975,1974,1973,1972,1971,1970,1969,1968,1967,1966,1965,1964,1963,1962,1961
Estas estatísticas em outros países:
AlbaniaAlgeriaAngolaArab WorldArgentinaArmeniaAustraliaAustriaAzerbaijanBahrainBangladeshBelarusBelgiumBeninBoliviaBosnia and HerzegovinaBotswanaBrazilBrunei DarussalamBulgariaCambodiaCameroonCanadaCentral Europe and the BalticsChileChinaColombiaCongo, Dem. Rep.Congo, Rep.Costa RicaCote d'IvoireCroatiaCubaCuracaoCyprusCzech RepublicDenmarkDominican RepublicEarly-demographic dividendEast Asia & PacificEast Asia & Pacific (excluding high income)East Asia & Pacific (IDA & IBRD countries)EcuadorEgypt, Arab Rep.El SalvadorEritreaEstoniaEthiopiaEuro areaEurope & Central AsiaEurope & Central Asia (excluding high income)Europe & Central Asia (IDA & IBRD countries)European UnionFinlandFragile and conflict affected situationsFranceGabonGeorgiaGermanyGhanaGibraltarGreeceGuatemalaHaitiHeavily indebted poor countries (HIPC)High incomeHondurasHong Kong SAR, ChinaHungaryIBRD onlyIcelandIDA & IBRD totalIDA blendIDA onlyIDA totalIndiaIndonesiaIran, Islamic Rep.IraqIrelandIsraelItalyJamaicaJapanJordanKazakhstanKenyaKorea, Dem. People’s Rep.Korea, Rep.KosovoKuwaitKyrgyz RepublicLate-demographic dividendLatin America & Caribbean Latin America & Caribbean (excluding high income)Latin America & the Caribbean (IDA & IBRD countries)LatviaLeast developed countries: UN classificationLebanonLibyaLithuaniaLow & middle incomeLower middle incomeLuxembourgMacedonia, FYRMalaysiaMaltaMauritiusMexicoMiddle East & North AfricaMiddle East & North Africa (excluding high income)Middle East & North Africa (IDA & IBRD countries)Middle incomeMoldovaMongoliaMontenegroMoroccoMozambiqueMyanmarNamibiaNepalNetherlandsNew ZealandNicaraguaNigerNigeriaNorth AmericaNorwayOECD membersOmanOther small statesPakistanPanamaParaguayPeruPhilippinesPolandPortugalPost-demographic dividendPre-demographic dividendQatarRomaniaRussian FederationSaudi ArabiaSenegalSerbiaSingaporeSlovak RepublicSloveniaSmall statesSouth AfricaSouth AsiaSouth Asia (IDA & IBRD)South SudanSpainSri LankaSub-Saharan Africa Sub-Saharan Africa (excluding high income)Sub-Saharan Africa (IDA & IBRD countries)SudanSwedenSwitzerlandSyrian Arab RepublicTajikistanTanzaniaThailandTogoTrinidad and TobagoTunisiaTurkeyTurkmenistanUkraineUnited Arab EmiratesUnited KingdomUnited StatesUpper middle incomeUruguayUzbekistanVenezuela, RBVietnamWorldYemen, Rep.ZambiaZimbabwe Linha do tempo:
Nesta escala de tempo está apresentado um gráfico de 1961 ano até 2015 ano Italy. Dados de 1960 ano ausente. O número de observações reais por data: 55.
Fonte (nome):
Indicadores de desenvolvimento mundial
Fonte (organização):
IEA Statistics © OECD/IEA 2014 (http://www.iea.org/stats/index.asp), subject to https://www.iea.org/t&c/termsandconditions/
Categorias:
Energy & Mining, Climate Change, Environment
Foi atualizado:
23 abr 2017 ano
Indicadores de alterações dos valores ao longo dos anos
Mínimo:
1.511
1 jan 1992 ano
Máximo:
22.031
1 jan 2015 ano
Na data de observação
Valor
Mudança absoluta
A alteração em relação ao valor anterior
1 jan 1961 ano
3.772
+3.772
0.0%
1 jan 1962 ano
3.832
+0.059
1.58%
1 jan 1963 ano
3.659
-0.173
-4.51%
1 jan 1964 ano
3.594
-0.064
-1.76%
1 jan 1965 ano
3.457
-0.137
-3.81%
1 jan 1966 ano
3.24
-0.217
-6.29%
1 jan 1967 ano
3.749
+0.509
15.7%
1 jan 1968 ano
3.612
-0.137
-3.66%
1 jan 1969 ano
3.504
-0.107
-2.96%
1 jan 1970 ano
3.478
-0.027
-0.76%
1 jan 1971 ano
3.629
+0.152
4.36%
1 jan 1972 ano
3.397
-0.233
-6.41%
1 jan 1973 ano
2.843
-0.553
-16.29%
1 jan 1974 ano
2.672
-0.172
-6.04%
1 jan 1975 ano
2.881
+0.209
7.83%
1 jan 1976 ano
2.734
-0.147
-5.09%
1 jan 1977 ano
2.356
-0.378
-13.83%
1 jan 1978 ano
2.261
-0.095
-4.03%
1 jan 1979 ano
2.201
-0.06
-2.64%
1 jan 1980 ano
2.137
-0.064
-2.93%
1 jan 1981 ano
2.158
+0.021
1.0%
1 jan 1982 ano
1.938
-0.22
-10.19%
1 jan 1983 ano
1.936
-0.002
-0.1%
1 jan 1984 ano
1.884
-0.053
-2.72%
1 jan 1985 ano
1.933
+0.049
2.6%
1 jan 1986 ano
1.763
-0.17
-8.81%
1 jan 1987 ano
1.95
+0.187
10.62%
1 jan 1988 ano
1.969
+0.02
1.0%
1 jan 1989 ano
1.991
+0.021
1.08%
1 jan 1990 ano
1.546
-0.445
-22.36%
1 jan 1991 ano
1.538
-0.007
-0.46%
1 jan 1992 ano
1.511
-0.028
-1.8%
1 jan 1993 ano
1.602
+0.091
6.04%
1 jan 1994 ano
1.728
+0.126
7.89%
1 jan 1995 ano
1.566
-0.162
-9.4%
1 jan 1996 ano
1.549
-0.017
-1.1%
1 jan 1997 ano
1.749
+0.2
12.91%
1 jan 1998 ano
1.867
+0.119
6.78%
1 jan 1999 ano
2.072
+0.205
10.98%
1 jan 2000 ano
2.295
+0.223
10.76%
1 jan 2001 ano
2.475
+0.18
7.82%
1 jan 2002 ano
2.772
+0.297
12.02%
1 jan 2003 ano
3.17
+0.398
14.35%
1 jan 2004 ano
3.562
+0.392
12.36%
1 jan 2005 ano
3.899
+0.338
9.48%
1 jan 2006 ano
4.168
+0.269
6.89%
1 jan 2007 ano
4.433
+0.265
6.37%
1 jan 2008 ano
4.834
+0.401
9.03%
1 jan 2009 ano
5.275
+0.442
9.14%
1 jan 2010 ano
6.977
+1.701
32.25%
1 jan 2011 ano
8.652
+1.675
24.0%
1 jan 2012 ano
12.353
+3.702
42.78%
1 jan 2013 ano
16.935
+4.582
37.09%
1 jan 2014 ano
20.575
+3.64
21.49%
1 jan 2015 ano
22.031
+1.456
7.07%
Classificação de países por estatísticas atuais por anos


Comentários: