29
/pt/
pt
AIzaSyAYiBZKx7MnpbEhh9jyipgxe19OcubqV5w
April 1, 2024
28039
East Asia & Pacific (excluding high income)
EAP
false
2
1
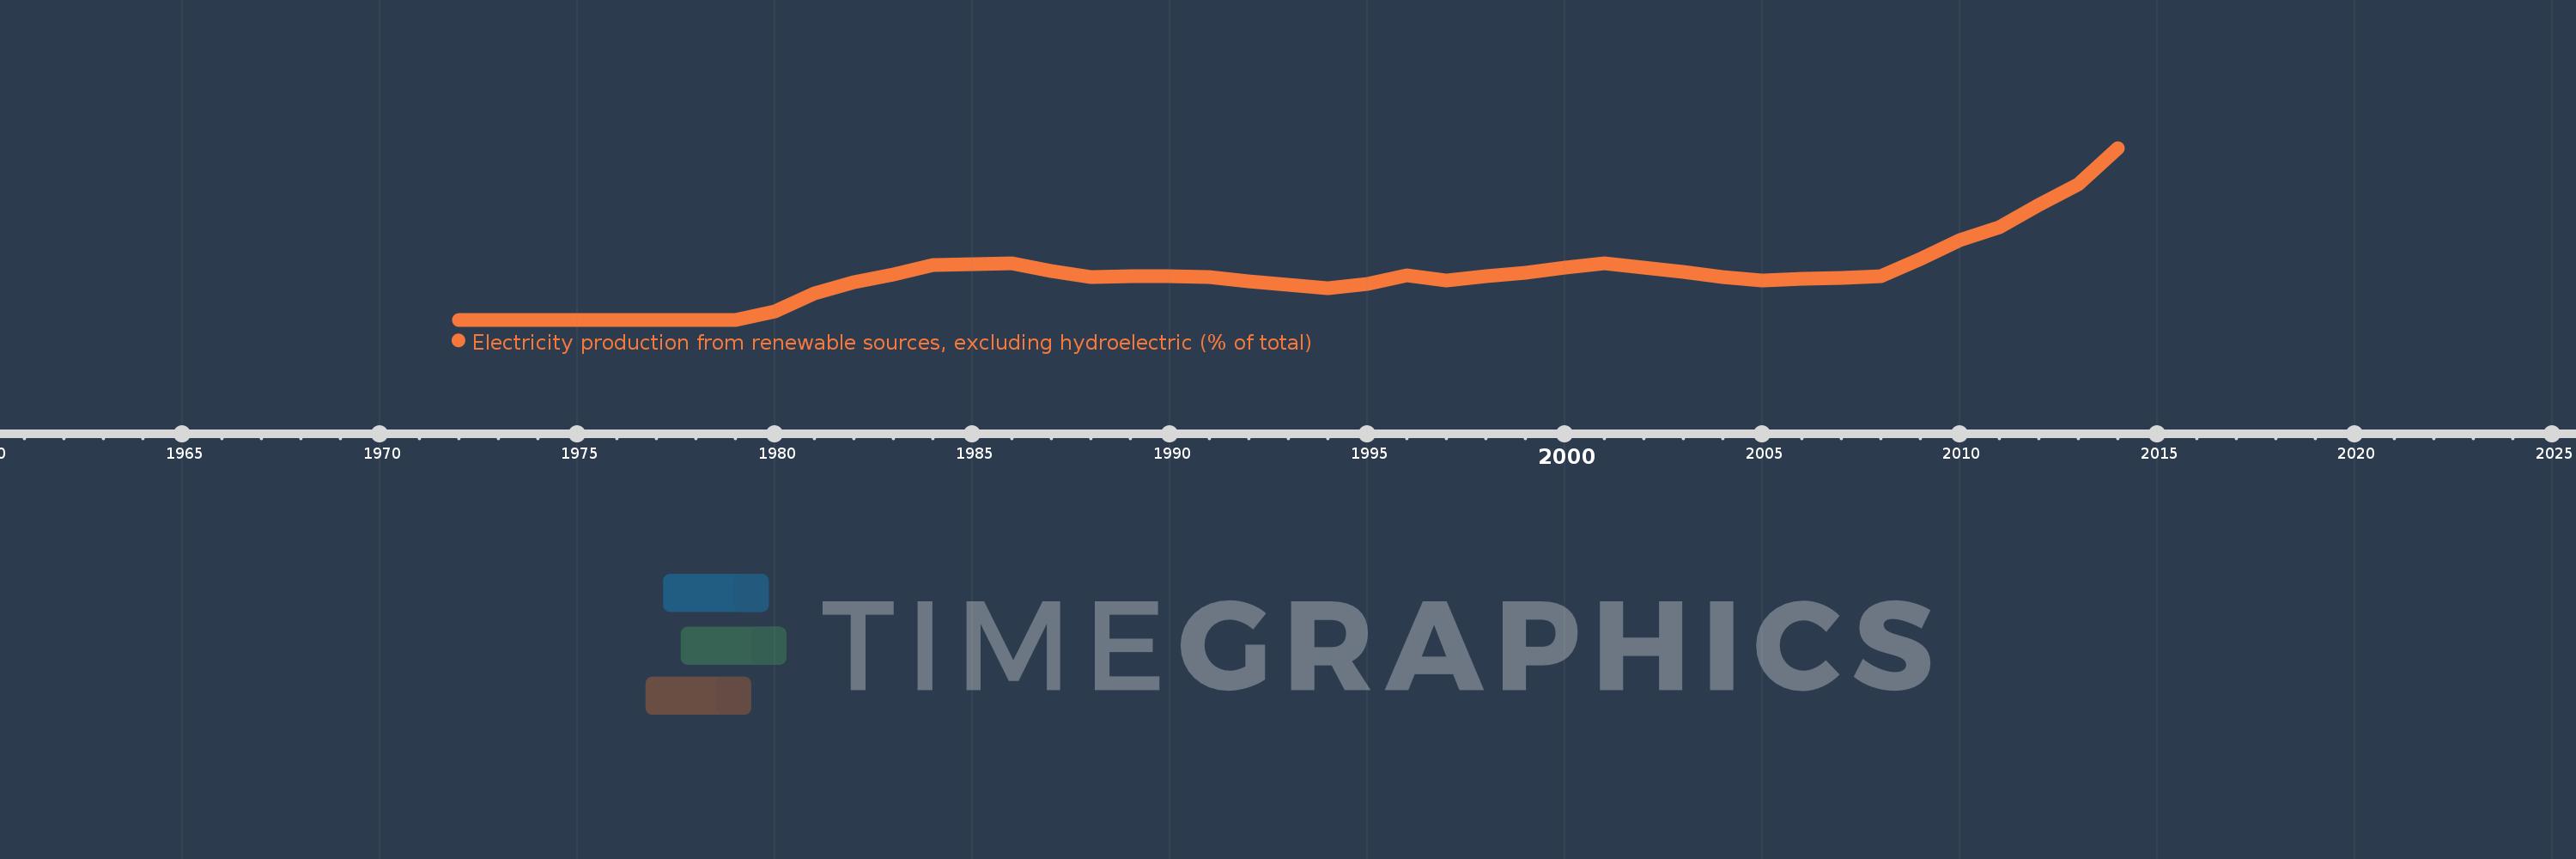
Electricity production from renewable sources, excluding hydroelectric (% of total)
2014,2013,2012,2011,2010,2009,2008,2007,2006,2005,2004,2003,2002,2001,2000,1999,1998,1997,1996,1995,1994,1993,1992,1991,1990,1989,1988,1987,1986,1985,1984,1983,1982,1981,1980,1979,1978,1977,1976,1975,1974,1973,1972
Estas estatísticas em outros países:
AlbaniaAlgeriaAngolaArab WorldArgentinaArmeniaAustraliaAustriaAzerbaijanBahrainBangladeshBelarusBelgiumBeninBoliviaBosnia and HerzegovinaBotswanaBrazilBrunei DarussalamBulgariaCambodiaCameroonCanadaCentral Europe and the BalticsChileChinaColombiaCongo, Dem. Rep.Congo, Rep.Costa RicaCote d'IvoireCroatiaCubaCuracaoCyprusCzech RepublicDenmarkDominican RepublicEarly-demographic dividendEast Asia & PacificEast Asia & Pacific (excluding high income)East Asia & Pacific (IDA & IBRD countries)EcuadorEgypt, Arab Rep.El SalvadorEritreaEstoniaEthiopiaEuro areaEurope & Central AsiaEurope & Central Asia (excluding high income)Europe & Central Asia (IDA & IBRD countries)European UnionFinlandFragile and conflict affected situationsFranceGabonGeorgiaGermanyGhanaGibraltarGreeceGuatemalaHaitiHeavily indebted poor countries (HIPC)High incomeHondurasHong Kong SAR, ChinaHungaryIBRD onlyIcelandIDA & IBRD totalIDA blendIDA onlyIDA totalIndiaIndonesiaIran, Islamic Rep.IraqIrelandIsraelItalyJamaicaJapanJordanKazakhstanKenyaKorea, Dem. People’s Rep.Korea, Rep.KosovoKuwaitKyrgyz RepublicLate-demographic dividendLatin America & Caribbean Latin America & Caribbean (excluding high income)Latin America & the Caribbean (IDA & IBRD countries)LatviaLeast developed countries: UN classificationLebanonLibyaLithuaniaLow & middle incomeLower middle incomeLuxembourgMacedonia, FYRMalaysiaMaltaMauritiusMexicoMiddle East & North AfricaMiddle East & North Africa (excluding high income)Middle East & North Africa (IDA & IBRD countries)Middle incomeMoldovaMongoliaMontenegroMoroccoMozambiqueMyanmarNamibiaNepalNetherlandsNew ZealandNicaraguaNigerNigeriaNorth AmericaNorwayOECD membersOmanOther small statesPakistanPanamaParaguayPeruPhilippinesPolandPortugalPost-demographic dividendPre-demographic dividendQatarRomaniaRussian FederationSaudi ArabiaSenegalSerbiaSingaporeSlovak RepublicSloveniaSmall statesSouth AfricaSouth AsiaSouth Asia (IDA & IBRD)South SudanSpainSri LankaSub-Saharan Africa Sub-Saharan Africa (excluding high income)Sub-Saharan Africa (IDA & IBRD countries)SudanSwedenSwitzerlandSyrian Arab RepublicTajikistanTanzaniaThailandTogoTrinidad and TobagoTunisiaTurkeyTurkmenistanUkraineUnited Arab EmiratesUnited KingdomUnited StatesUpper middle incomeUruguayUzbekistanVenezuela, RBVietnamWorldYemen, Rep.ZambiaZimbabwe Linha do tempo:
Nesta escala de tempo está apresentado um gráfico de 1972 ano até 2014 ano East Asia & Pacific (excluding high income). Dados de 1971 ano ausente. O número de observações reais por data: 43.
Fonte (nome):
Indicadores de desenvolvimento mundial
Fonte (organização):
IEA Statistics © OECD/IEA 2014 (http://www.iea.org/stats/index.asp), subject to https://www.iea.org/t&c/termsandconditions/
Categorias:
Energy & Mining, Climate Change, Environment
Foi atualizado:
23 abr 2017 ano
Indicadores de alterações dos valores ao longo dos anos
Máximo:
3.589
1 jan 2014 ano
Na data de observação
Valor
Mudança absoluta
A alteração em relação ao valor anterior
1 jan 1972 ano
0.0
0.0
0.0%
1 jan 1979 ano
0.001
+0.001
%
1 jan 1980 ano
0.179
+0.178
19.35 mil%
1 jan 1981 ano
0.546
+0.367
204.94%
1 jan 1982 ano
0.792
+0.246
45.07%
1 jan 1983 ano
0.949
+0.156
19.7%
1 jan 1984 ano
1.144
+0.195
20.61%
1 jan 1985 ano
1.158
+0.014
1.24%
1 jan 1986 ano
1.176
+0.017
1.51%
1 jan 1987 ano
1.02
-0.156
-13.25%
1 jan 1988 ano
0.894
-0.126
-12.31%
1 jan 1989 ano
0.904
+0.01
1.06%
1 jan 1990 ano
0.904
+0.001
0.06%
1 jan 1991 ano
0.895
-0.009
-1.05%
1 jan 1992 ano
0.799
-0.096
-10.74%
1 jan 1993 ano
0.727
-0.072
-9.01%
1 jan 1994 ano
0.657
-0.07
-9.59%
1 jan 1995 ano
0.752
+0.095
14.4%
1 jan 1996 ano
0.92
+0.168
22.34%
1 jan 1997 ano
0.828
-0.091
-9.93%
1 jan 1998 ano
0.904
+0.076
9.18%
1 jan 1999 ano
0.989
+0.085
9.35%
1 jan 2000 ano
1.092
+0.103
10.41%
1 jan 2001 ano
1.173
+0.082
7.48%
1 jan 2002 ano
1.087
-0.087
-7.37%
1 jan 2003 ano
0.999
-0.088
-8.06%
1 jan 2004 ano
0.89
-0.109
-10.95%
1 jan 2005 ano
0.829
-0.061
-6.8%
1 jan 2006 ano
0.853
+0.024
2.86%
1 jan 2007 ano
0.88
+0.027
3.15%
1 jan 2008 ano
0.909
+0.029
3.25%
1 jan 2009 ano
1.272
+0.364
40.04%
1 jan 2010 ano
1.655
+0.383
30.11%
1 jan 2011 ano
1.937
+0.281
17.0%
1 jan 2012 ano
2.405
+0.468
24.16%
1 jan 2013 ano
2.838
+0.433
18.01%
1 jan 2014 ano
3.589
+0.751
26.45%
Classificação de países por estatísticas atuais por anos


Comentários: