29
/pt/
pt
AIzaSyAYiBZKx7MnpbEhh9jyipgxe19OcubqV5w
April 1, 2024
275589
United Kingdom
GBR
true
2
1
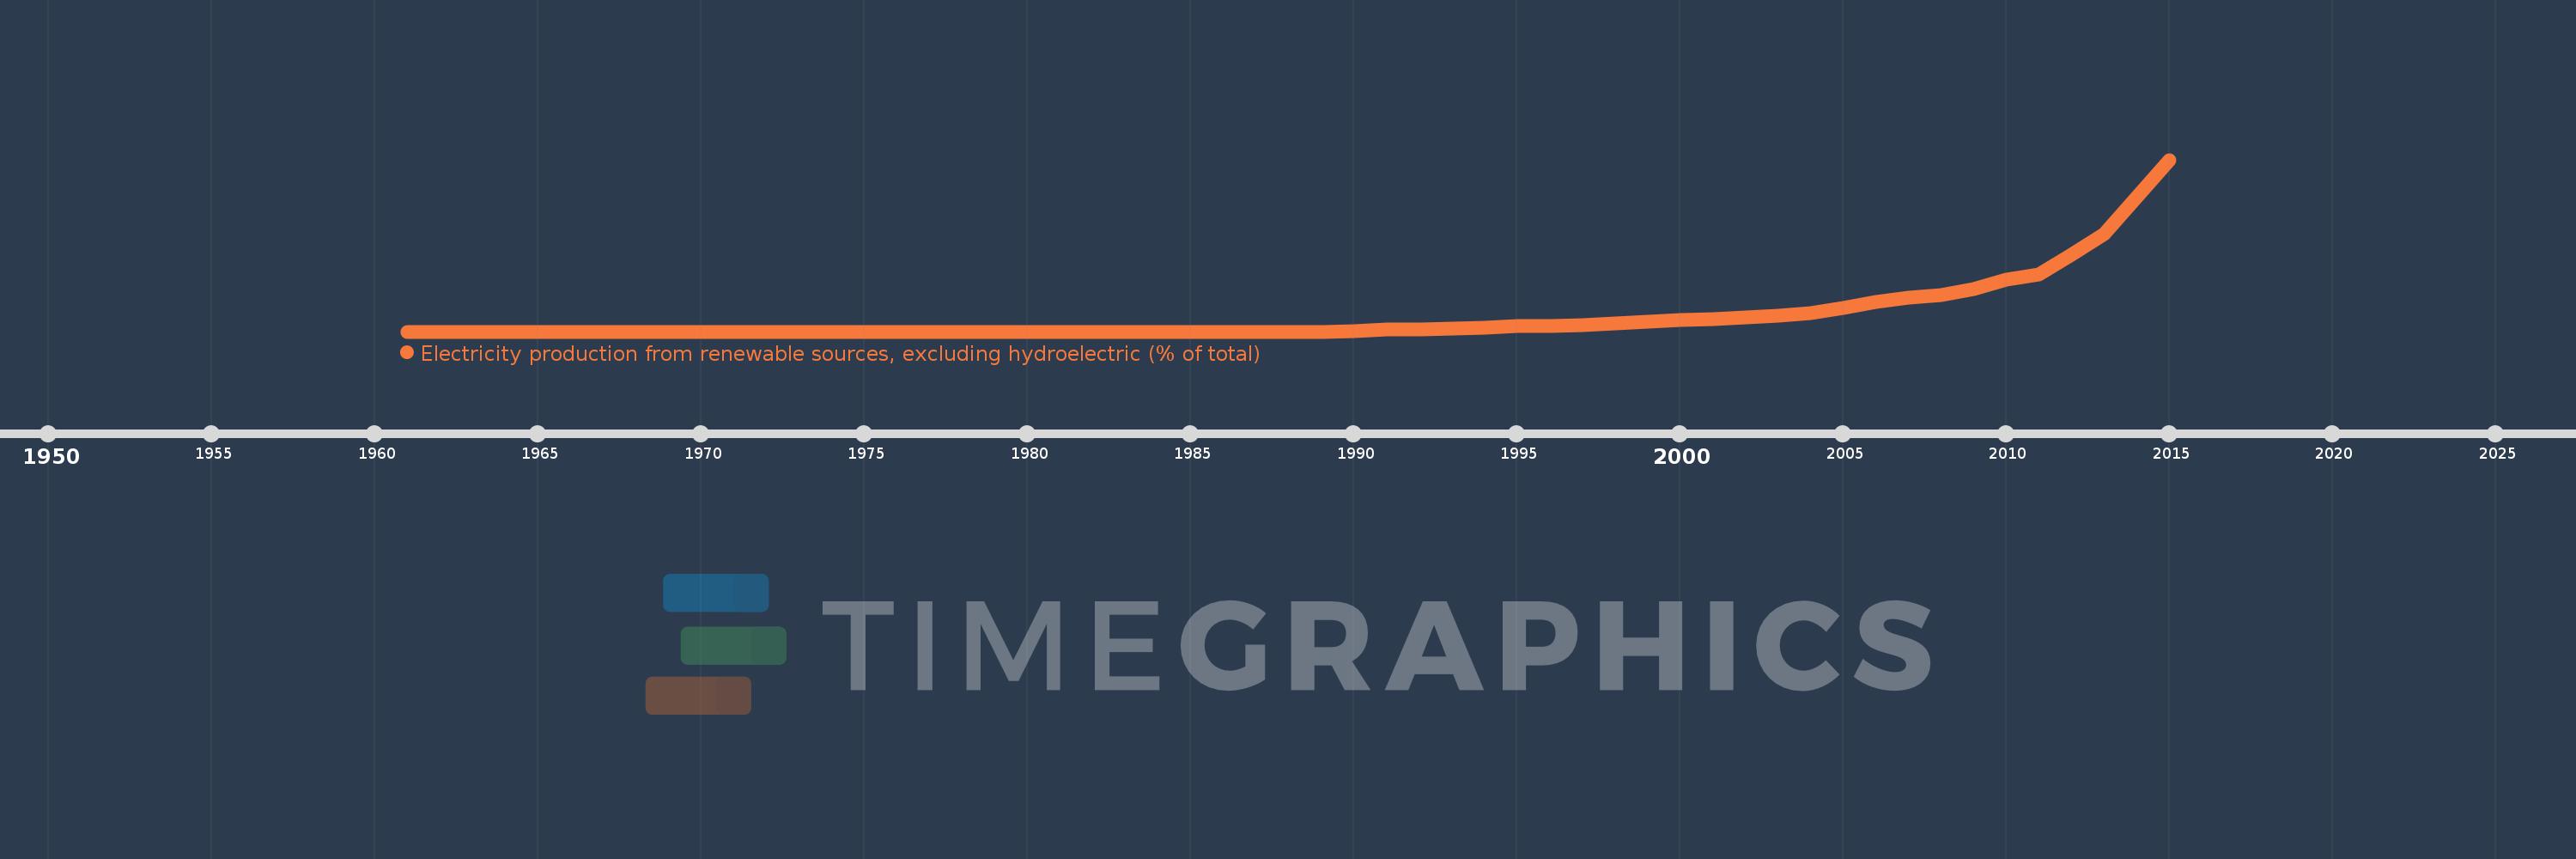
Electricity production from renewable sources, excluding hydroelectric (% of total)
2015,2014,2013,2012,2011,2010,2009,2008,2007,2006,2005,2004,2003,2002,2001,2000,1999,1998,1997,1996,1995,1994,1993,1992,1991,1990,1989,1988,1987,1986,1985,1984,1983,1982,1981,1980,1979,1978,1977,1976,1975,1974,1973,1972,1971,1970,1969,1968,1967,1966,1965,1964,1963,1962,1961
Estas estatísticas em outros países:
AlbaniaAlgeriaAngolaArab WorldArgentinaArmeniaAustraliaAustriaAzerbaijanBahrainBangladeshBelarusBelgiumBeninBoliviaBosnia and HerzegovinaBotswanaBrazilBrunei DarussalamBulgariaCambodiaCameroonCanadaCentral Europe and the BalticsChileChinaColombiaCongo, Dem. Rep.Congo, Rep.Costa RicaCote d'IvoireCroatiaCubaCuracaoCyprusCzech RepublicDenmarkDominican RepublicEarly-demographic dividendEast Asia & PacificEast Asia & Pacific (excluding high income)East Asia & Pacific (IDA & IBRD countries)EcuadorEgypt, Arab Rep.El SalvadorEritreaEstoniaEthiopiaEuro areaEurope & Central AsiaEurope & Central Asia (excluding high income)Europe & Central Asia (IDA & IBRD countries)European UnionFinlandFragile and conflict affected situationsFranceGabonGeorgiaGermanyGhanaGibraltarGreeceGuatemalaHaitiHeavily indebted poor countries (HIPC)High incomeHondurasHong Kong SAR, ChinaHungaryIBRD onlyIcelandIDA & IBRD totalIDA blendIDA onlyIDA totalIndiaIndonesiaIran, Islamic Rep.IraqIrelandIsraelItalyJamaicaJapanJordanKazakhstanKenyaKorea, Dem. People’s Rep.Korea, Rep.KosovoKuwaitKyrgyz RepublicLate-demographic dividendLatin America & Caribbean Latin America & Caribbean (excluding high income)Latin America & the Caribbean (IDA & IBRD countries)LatviaLeast developed countries: UN classificationLebanonLibyaLithuaniaLow & middle incomeLower middle incomeLuxembourgMacedonia, FYRMalaysiaMaltaMauritiusMexicoMiddle East & North AfricaMiddle East & North Africa (excluding high income)Middle East & North Africa (IDA & IBRD countries)Middle incomeMoldovaMongoliaMontenegroMoroccoMozambiqueMyanmarNamibiaNepalNetherlandsNew ZealandNicaraguaNigerNigeriaNorth AmericaNorwayOECD membersOmanOther small statesPakistanPanamaParaguayPeruPhilippinesPolandPortugalPost-demographic dividendPre-demographic dividendQatarRomaniaRussian FederationSaudi ArabiaSenegalSerbiaSingaporeSlovak RepublicSloveniaSmall statesSouth AfricaSouth AsiaSouth Asia (IDA & IBRD)South SudanSpainSri LankaSub-Saharan Africa Sub-Saharan Africa (excluding high income)Sub-Saharan Africa (IDA & IBRD countries)SudanSwedenSwitzerlandSyrian Arab RepublicTajikistanTanzaniaThailandTogoTrinidad and TobagoTunisiaTurkeyTurkmenistanUkraineUnited Arab EmiratesUnited KingdomUnited StatesUpper middle incomeUruguayUzbekistanVenezuela, RBVietnamWorldYemen, Rep.ZambiaZimbabwe Linha do tempo:
Nesta escala de tempo está apresentado um gráfico de 1961 ano até 2015 ano United Kingdom. Dados de 1960 ano ausente. O número de observações reais por data: 55.
Fonte (nome):
Indicadores de desenvolvimento mundial
Fonte (organização):
IEA Statistics © OECD/IEA 2014 (http://www.iea.org/stats/index.asp), subject to https://www.iea.org/t&c/termsandconditions/
Categorias:
Energy & Mining, Climate Change, Environment
Foi atualizado:
23 abr 2017 ano
Indicadores de alterações dos valores ao longo dos anos
Máximo:
17.603
1 jan 2015 ano
Na data de observação
Valor
Mudança absoluta
A alteração em relação ao valor anterior
1 jan 1961 ano
0.0
0.0
0.0%
1 jan 1986 ano
0.0
0.0
-4.86%
1 jan 1987 ano
0.0
0.0
-1.55%
1 jan 1988 ano
0.0
0.0
-100.0%
1 jan 1990 ano
0.003
+0.003
782.78%
1 jan 1991 ano
0.19
+0.187
6.5 mil%
1 jan 1992 ano
0.218
+0.027
14.43%
1 jan 1993 ano
0.305
+0.087
40.22%
1 jan 1994 ano
0.44
+0.135
44.33%
1 jan 1995 ano
0.573
+0.132
30.07%
1 jan 1996 ano
0.611
+0.039
6.79%
1 jan 1997 ano
0.656
+0.045
7.31%
1 jan 1998 ano
0.795
+0.139
21.21%
1 jan 1999 ano
0.978
+0.183
22.96%
1 jan 2000 ano
1.172
+0.194
19.83%
1 jan 2001 ano
1.305
+0.133
11.33%
1 jan 2002 ano
1.437
+0.132
10.12%
1 jan 2003 ano
1.648
+0.212
14.75%
1 jan 2004 ano
1.871
+0.223
13.51%
1 jan 2005 ano
2.378
+0.506
27.06%
1 jan 2006 ano
3.039
+0.661
27.8%
1 jan 2007 ano
3.434
+0.396
13.03%
1 jan 2008 ano
3.718
+0.284
8.26%
1 jan 2009 ano
4.334
+0.616
16.56%
1 jan 2010 ano
5.356
+1.022
23.58%
1 jan 2011 ano
5.87
+0.514
9.59%
1 jan 2012 ano
7.909
+2.039
34.74%
1 jan 2013 ano
9.969
+2.06
26.04%
1 jan 2014 ano
13.746
+3.777
37.89%
1 jan 2015 ano
17.603
+3.857
28.06%
Classificação de países por estatísticas atuais por anos


Comentários: