29
/pt/
pt
AIzaSyAYiBZKx7MnpbEhh9jyipgxe19OcubqV5w
April 1, 2024
210250
Nicaragua
NIC
true
2
1
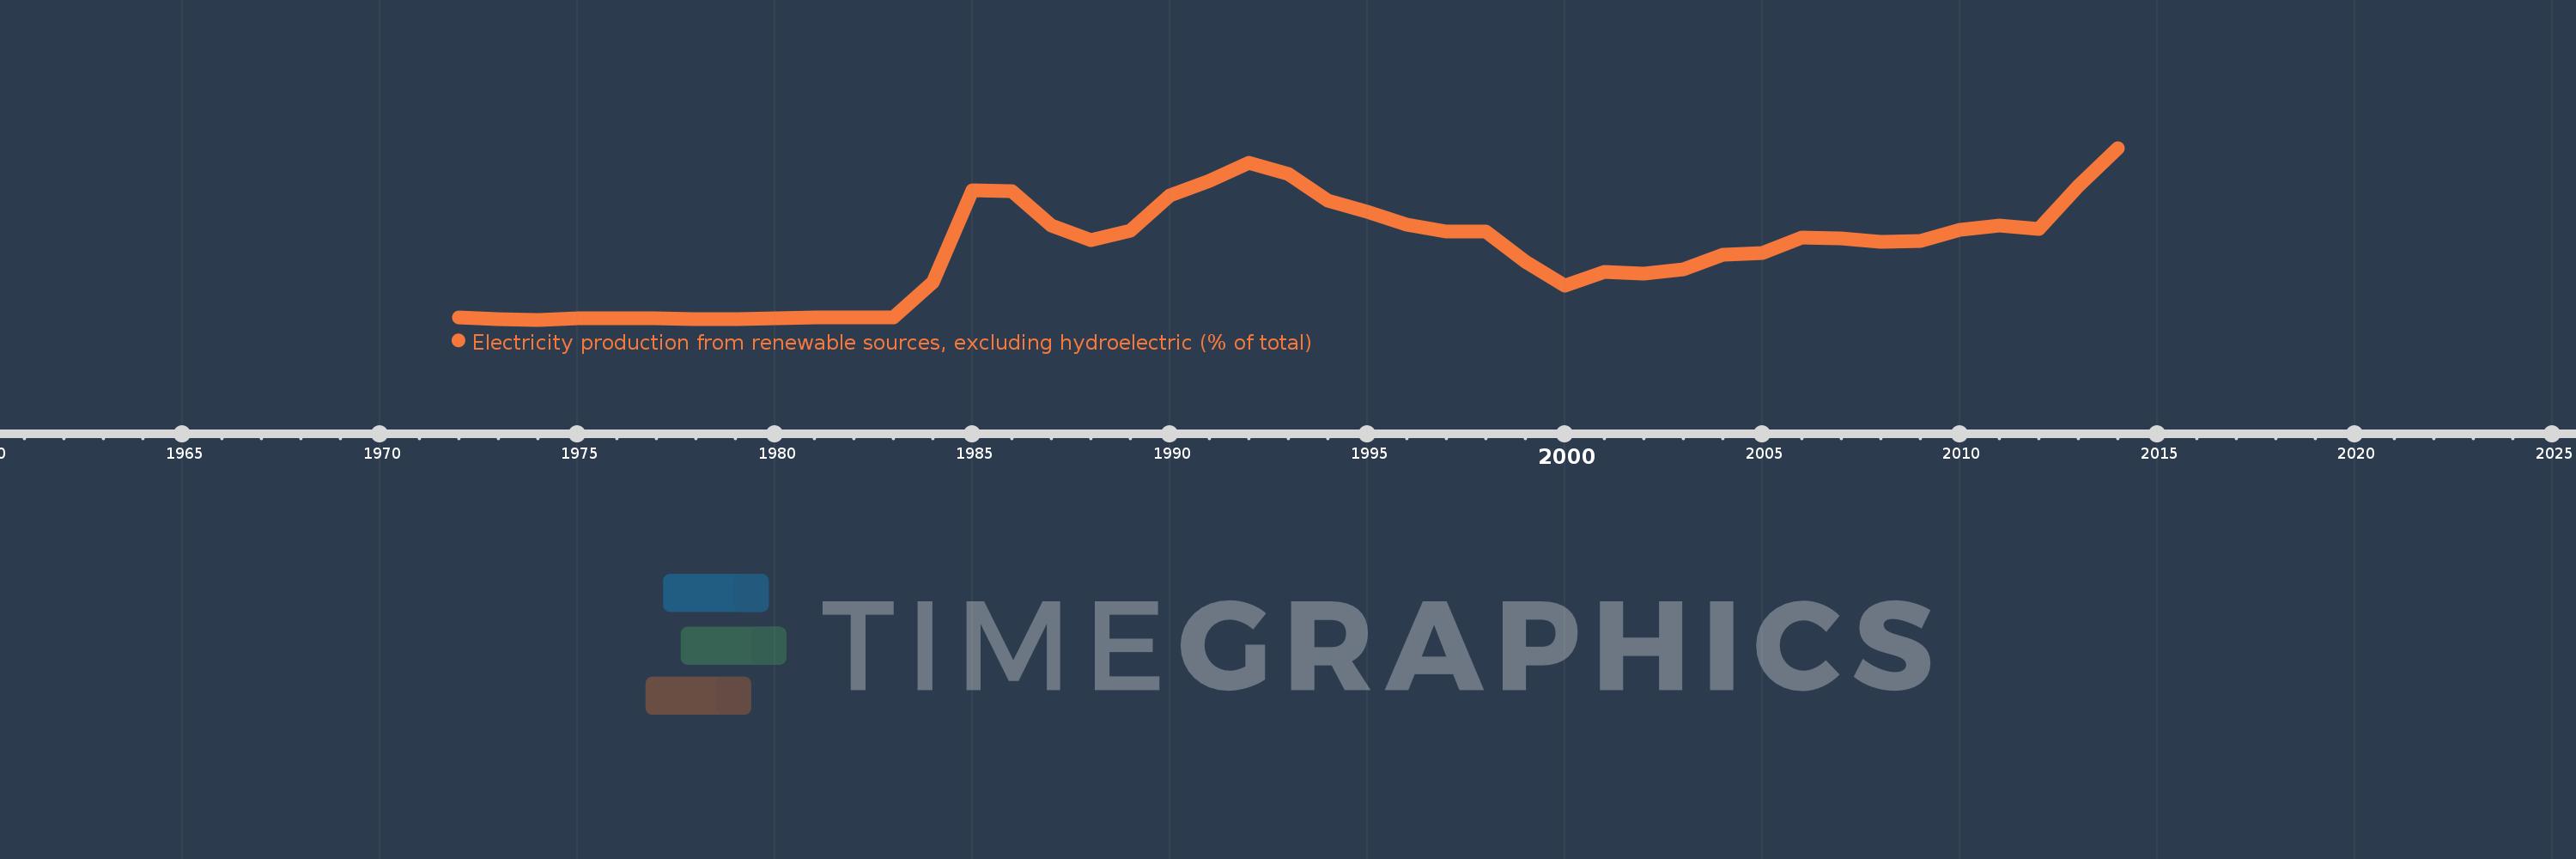
Electricity production from renewable sources, excluding hydroelectric (% of total)
2014,2013,2012,2011,2010,2009,2008,2007,2006,2005,2004,2003,2002,2001,2000,1999,1998,1997,1996,1995,1994,1993,1992,1991,1990,1989,1988,1987,1986,1985,1984,1983,1982,1981,1980,1979,1978,1977,1976,1975,1974,1973,1972
Estas estatísticas em outros países:
AlbaniaAlgeriaAngolaArab WorldArgentinaArmeniaAustraliaAustriaAzerbaijanBahrainBangladeshBelarusBelgiumBeninBoliviaBosnia and HerzegovinaBotswanaBrazilBrunei DarussalamBulgariaCambodiaCameroonCanadaCentral Europe and the BalticsChileChinaColombiaCongo, Dem. Rep.Congo, Rep.Costa RicaCote d'IvoireCroatiaCubaCuracaoCyprusCzech RepublicDenmarkDominican RepublicEarly-demographic dividendEast Asia & PacificEast Asia & Pacific (excluding high income)East Asia & Pacific (IDA & IBRD countries)EcuadorEgypt, Arab Rep.El SalvadorEritreaEstoniaEthiopiaEuro areaEurope & Central AsiaEurope & Central Asia (excluding high income)Europe & Central Asia (IDA & IBRD countries)European UnionFinlandFragile and conflict affected situationsFranceGabonGeorgiaGermanyGhanaGibraltarGreeceGuatemalaHaitiHeavily indebted poor countries (HIPC)High incomeHondurasHong Kong SAR, ChinaHungaryIBRD onlyIcelandIDA & IBRD totalIDA blendIDA onlyIDA totalIndiaIndonesiaIran, Islamic Rep.IraqIrelandIsraelItalyJamaicaJapanJordanKazakhstanKenyaKorea, Dem. People’s Rep.Korea, Rep.KosovoKuwaitKyrgyz RepublicLate-demographic dividendLatin America & Caribbean Latin America & Caribbean (excluding high income)Latin America & the Caribbean (IDA & IBRD countries)LatviaLeast developed countries: UN classificationLebanonLibyaLithuaniaLow & middle incomeLower middle incomeLuxembourgMacedonia, FYRMalaysiaMaltaMauritiusMexicoMiddle East & North AfricaMiddle East & North Africa (excluding high income)Middle East & North Africa (IDA & IBRD countries)Middle incomeMoldovaMongoliaMontenegroMoroccoMozambiqueMyanmarNamibiaNepalNetherlandsNew ZealandNicaraguaNigerNigeriaNorth AmericaNorwayOECD membersOmanOther small statesPakistanPanamaParaguayPeruPhilippinesPolandPortugalPost-demographic dividendPre-demographic dividendQatarRomaniaRussian FederationSaudi ArabiaSenegalSerbiaSingaporeSlovak RepublicSloveniaSmall statesSouth AfricaSouth AsiaSouth Asia (IDA & IBRD)South SudanSpainSri LankaSub-Saharan Africa Sub-Saharan Africa (excluding high income)Sub-Saharan Africa (IDA & IBRD countries)SudanSwedenSwitzerlandSyrian Arab RepublicTajikistanTanzaniaThailandTogoTrinidad and TobagoTunisiaTurkeyTurkmenistanUkraineUnited Arab EmiratesUnited KingdomUnited StatesUpper middle incomeUruguayUzbekistanVenezuela, RBVietnamWorldYemen, Rep.ZambiaZimbabwe Linha do tempo:
Nesta escala de tempo está apresentado um gráfico de 1972 ano até 2014 ano Nicaragua. Dados de 1971 ano ausente. O número de observações reais por data: 43.
Fonte (nome):
Indicadores de desenvolvimento mundial
Fonte (organização):
IEA Statistics © OECD/IEA 2014 (http://www.iea.org/stats/index.asp), subject to https://www.iea.org/t&c/termsandconditions/
Categorias:
Energy & Mining, Climate Change, Environment
Foi atualizado:
23 abr 2017 ano
Indicadores de alterações dos valores ao longo dos anos
Mínimo:
1.18
1 jan 1974 ano
Máximo:
41.388
1 jan 2014 ano
Na data de observação
Valor
Mudança absoluta
A alteração em relação ao valor anterior
1 jan 1972 ano
1.634
+1.634
0.0%
1 jan 1973 ano
1.418
-0.216
-13.19%
1 jan 1974 ano
1.18
-0.238
-16.81%
1 jan 1975 ano
1.463
+0.283
24.02%
1 jan 1976 ano
1.587
+0.124
8.47%
1 jan 1977 ano
1.566
-0.022
-1.37%
1 jan 1978 ano
1.298
-0.268
-17.12%
1 jan 1979 ano
1.406
+0.108
8.35%
1 jan 1980 ano
1.533
+0.127
9.06%
1 jan 1981 ano
1.791
+0.258
16.8%
1 jan 1982 ano
1.65
-0.141
-7.85%
1 jan 1983 ano
1.796
+0.146
8.84%
1 jan 1984 ano
9.909
+8.112
451.59%
1 jan 1985 ano
31.478
+21.569
217.67%
1 jan 1986 ano
31.202
-0.276
-0.88%
1 jan 1987 ano
23.303
-7.899
-25.32%
1 jan 1988 ano
19.718
-3.584
-15.38%
1 jan 1989 ano
22.031
+2.313
11.73%
1 jan 1990 ano
30.212
+8.18
37.13%
1 jan 1991 ano
33.699
+3.488
11.54%
1 jan 1992 ano
37.89
+4.19
12.43%
1 jan 1993 ano
35.265
-2.624
-6.93%
1 jan 1994 ano
29.164
-6.101
-17.3%
1 jan 1995 ano
26.518
-2.647
-9.07%
1 jan 1996 ano
23.504
-3.014
-11.36%
1 jan 1997 ano
21.877
-1.627
-6.92%
1 jan 1998 ano
21.858
-0.018
-0.08%
1 jan 1999 ano
14.784
-7.074
-32.37%
1 jan 2000 ano
9.234
-5.55
-37.54%
1 jan 2001 ano
12.463
+3.229
34.97%
1 jan 2002 ano
11.984
-0.479
-3.84%
1 jan 2003 ano
13.015
+1.031
8.6%
1 jan 2004 ano
16.342
+3.327
25.56%
1 jan 2005 ano
16.735
+0.393
2.41%
1 jan 2006 ano
20.42
+3.684
22.02%
1 jan 2007 ano
20.23
-0.19
-0.93%
1 jan 2008 ano
19.451
-0.778
-3.85%
1 jan 2009 ano
19.637
+0.186
0.95%
1 jan 2010 ano
22.299
+2.662
13.56%
1 jan 2011 ano
23.23
+0.931
4.17%
1 jan 2012 ano
22.385
-0.845
-3.64%
1 jan 2013 ano
32.424
+10.039
44.85%
1 jan 2014 ano
41.388
+8.965
27.65%
Classificação de países por estatísticas atuais por anos


Comentários: