29
/pt/
pt
AIzaSyAYiBZKx7MnpbEhh9jyipgxe19OcubqV5w
April 1, 2024
40080
IDA total
IDA
false
2
1
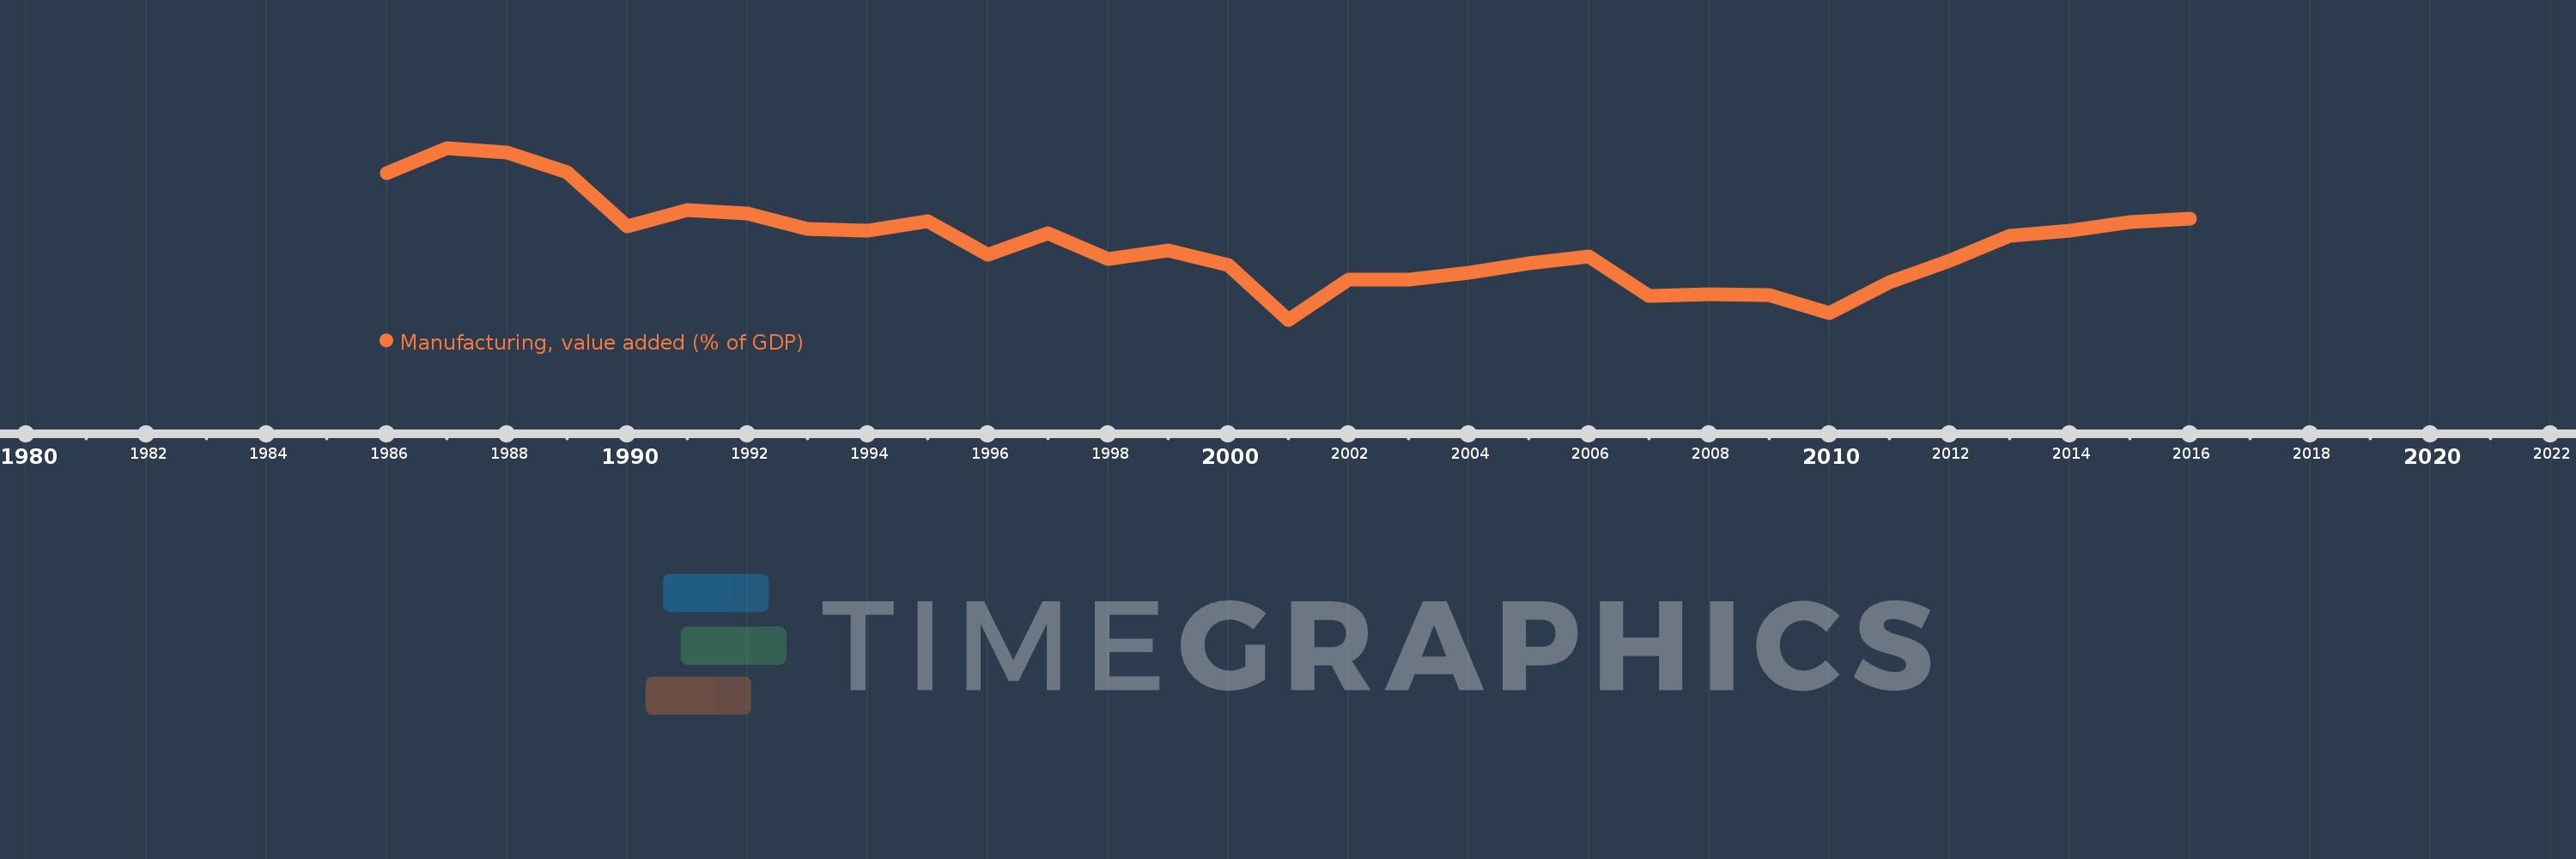
Manufacturing, value added (% of GDP)
2016,2015,2014,2013,2012,2011,2010,2009,2008,2007,2006,2005,2004,2003,2002,2001,2000,1999,1998,1997,1996,1995,1994,1993,1992,1991,1990,1989,1988,1987,1986
Estas estatísticas em outros países:
AfghanistanAlbaniaAlgeriaAndorraAngolaAntigua and BarbudaArab WorldArgentinaArmeniaArubaAustraliaAustriaAzerbaijanBahamas, TheBahrainBangladeshBarbadosBelarusBelgiumBelizeBeninBermudaBhutanBoliviaBosnia and HerzegovinaBotswanaBrazilBrunei DarussalamBurkina FasoBurundiCabo VerdeCambodiaCameroonCanadaCaribbean small statesCayman IslandsCentral African RepublicCentral Europe and the BalticsChadChileChinaColombiaComorosCongo, Dem. Rep.Congo, Rep.Costa RicaCote d'IvoireCroatiaCubaCyprusCzech RepublicDenmarkDjiboutiDominicaDominican RepublicEarly-demographic dividendEast Asia & PacificEast Asia & Pacific (excluding high income)East Asia & Pacific (IDA & IBRD countries)EcuadorEgypt, Arab Rep.El SalvadorEquatorial GuineaEritreaEstoniaEthiopiaEuro areaEurope & Central AsiaEurope & Central Asia (excluding high income)Europe & Central Asia (IDA & IBRD countries)European UnionFaroe IslandsFijiFinlandFragile and conflict affected situationsFranceGabonGambia, TheGeorgiaGermanyGhanaGreeceGrenadaGuatemalaGuineaGuinea-BissauGuyanaHeavily indebted poor countries (HIPC)High incomeHondurasHong Kong SAR, ChinaHungaryIBRD onlyIcelandIDA & IBRD totalIDA blendIDA onlyIDA totalIndiaIndonesiaIran, Islamic Rep.IrelandItalyJamaicaJapanJordanKazakhstanKenyaKiribatiKorea, Rep.KosovoKuwaitKyrgyz RepublicLao PDRLate-demographic dividendLatin America & Caribbean Latin America & Caribbean (excluding high income)Latin America & the Caribbean (IDA & IBRD countries)LatviaLeast developed countries: UN classificationLebanonLesothoLibyaLithuaniaLow & middle incomeLow incomeLower middle incomeLuxembourgMacao SAR, ChinaMacedonia, FYRMadagascarMalawiMalaysiaMaldivesMaliMaltaMarshall IslandsMauritaniaMauritiusMexicoMicronesia, Fed. Sts.Middle East & North AfricaMiddle East & North Africa (excluding high income)Middle East & North Africa (IDA & IBRD countries)Middle incomeMoldovaMongoliaMontenegroMoroccoMozambiqueMyanmarNamibiaNepalNetherlandsNew CaledoniaNew ZealandNicaraguaNigerNigeriaNorth AmericaNorwayOECD membersOmanOther small statesPacific island small statesPakistanPalauPanamaPapua New GuineaParaguayPeruPhilippinesPolandPortugalPost-demographic dividendPre-demographic dividendPuerto RicoQatarRomaniaRussian FederationRwandaSao Tome and PrincipeSaudi ArabiaSenegalSerbiaSeychellesSierra LeoneSingaporeSlovak RepublicSloveniaSmall statesSolomon IslandsSomaliaSouth AfricaSouth AsiaSouth Asia (IDA & IBRD)SpainSri LankaSt. Kitts and NevisSt. LuciaSt. Vincent and the GrenadinesSub-Saharan Africa Sub-Saharan Africa (excluding high income)Sub-Saharan Africa (IDA & IBRD countries)SudanSurinameSwazilandSwedenSwitzerlandSyrian Arab RepublicTajikistanTanzaniaThailandTimor-LesteTogoTongaTrinidad and TobagoTunisiaTurkeyTurkmenistanTuvaluUgandaUkraineUnited KingdomUnited StatesUpper middle incomeUruguayUzbekistanVanuatuVenezuela, RBVietnamWest Bank and GazaWorldYemen, Rep.ZambiaZimbabwe Linha do tempo:
Nesta escala de tempo está apresentado um gráfico de 1986 ano até 2016 ano IDA total. Dados de 1985 ano ausente. O número de observações reais por data: 31.
Fonte (nome):
Indicadores de desenvolvimento mundial
Fonte (organização):
World Bank national accounts data, and OECD National Accounts data files.
Categorias:
Economy & Growth
Foi atualizado:
23 abr 2017 ano
Indicadores de alterações dos valores ao longo dos anos
Mínimo:
10.853
1 jan 2001 ano
Máximo:
13.285
1 jan 1987 ano
Na data de observação
Valor
Mudança absoluta
A alteração em relação ao valor anterior
1 jan 1986 ano
12.923
+12.923
0.0%
1 jan 1987 ano
13.285
+0.362
2.8%
1 jan 1988 ano
13.224
-0.061
-0.46%
1 jan 1989 ano
12.945
-0.279
-2.11%
1 jan 1990 ano
12.179
-0.766
-5.92%
1 jan 1991 ano
12.407
+0.228
1.88%
1 jan 1992 ano
12.358
-0.049
-0.39%
1 jan 1993 ano
12.137
-0.221
-1.79%
1 jan 1994 ano
12.109
-0.028
-0.23%
1 jan 1995 ano
12.251
+0.142
1.18%
1 jan 1996 ano
11.773
-0.478
-3.9%
1 jan 1997 ano
12.074
+0.3
2.55%
1 jan 1998 ano
11.711
-0.363
-3.01%
1 jan 1999 ano
11.832
+0.121
1.03%
1 jan 2000 ano
11.623
-0.208
-1.76%
1 jan 2001 ano
10.853
-0.77
-6.63%
1 jan 2002 ano
11.425
+0.572
5.27%
1 jan 2003 ano
11.423
-0.002
-0.01%
1 jan 2004 ano
11.515
+0.092
0.8%
1 jan 2005 ano
11.648
+0.133
1.16%
1 jan 2006 ano
11.744
+0.096
0.82%
1 jan 2007 ano
11.193
-0.551
-4.69%
1 jan 2008 ano
11.214
+0.021
0.19%
1 jan 2009 ano
11.196
-0.017
-0.16%
1 jan 2010 ano
10.944
-0.253
-2.26%
1 jan 2011 ano
11.383
+0.439
4.01%
1 jan 2012 ano
11.694
+0.311
2.73%
1 jan 2013 ano
12.04
+0.346
2.96%
1 jan 2014 ano
12.115
+0.075
0.62%
1 jan 2015 ano
12.23
+0.114
0.95%
1 jan 2016 ano
12.282
+0.052
0.43%
Classificação de países por estatísticas atuais por anos


Comentários: