29
/pt/
pt
AIzaSyAYiBZKx7MnpbEhh9jyipgxe19OcubqV5w
April 1, 2024
122398
Dominican Republic
DOM
true
2
1
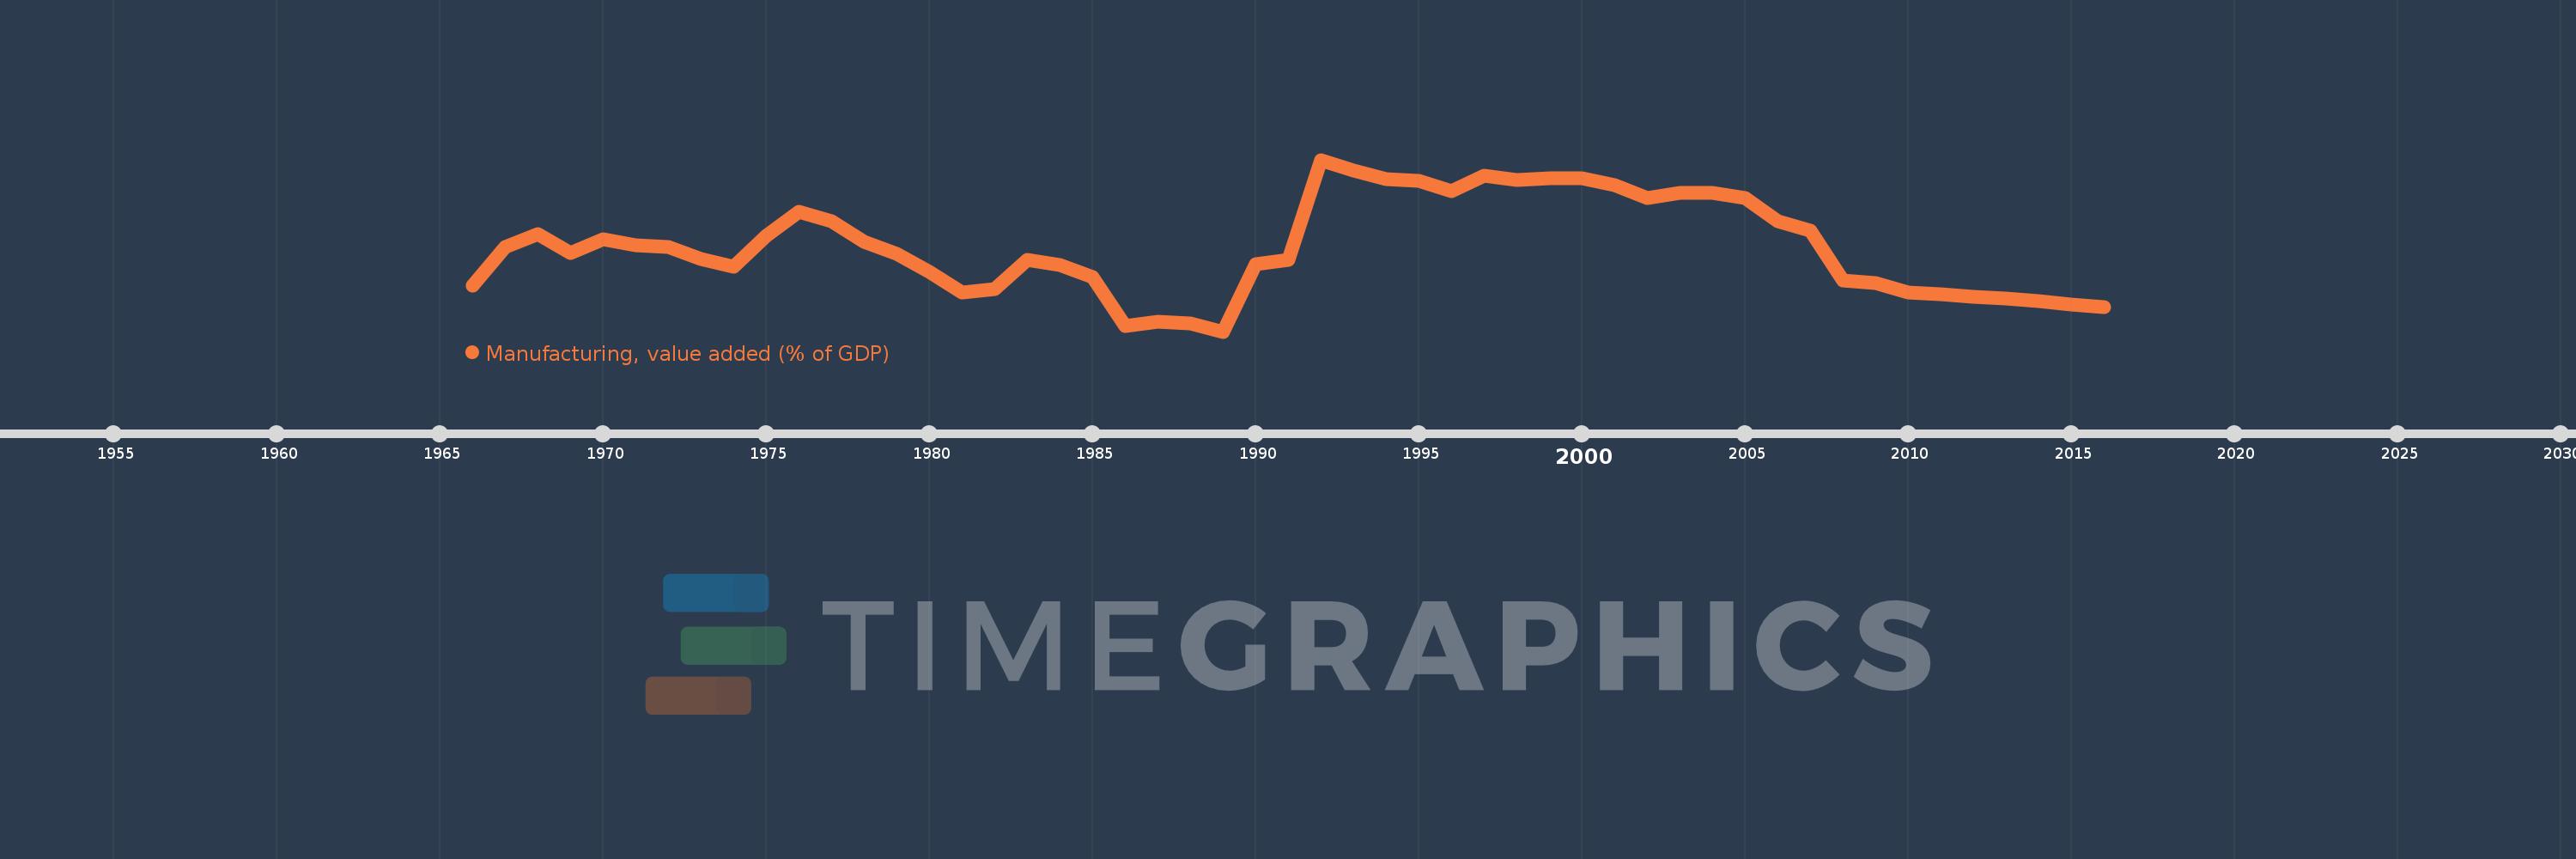
Manufacturing, value added (% of GDP)
2016,2015,2014,2013,2012,2011,2010,2009,2008,2007,2006,2005,2004,2003,2002,2001,2000,1999,1998,1997,1996,1995,1994,1993,1992,1991,1990,1989,1988,1987,1986,1985,1984,1983,1982,1981,1980,1979,1978,1977,1976,1975,1974,1973,1972,1971,1970,1969,1968,1967,1966
Estas estatísticas em outros países:
AfghanistanAlbaniaAlgeriaAndorraAngolaAntigua and BarbudaArab WorldArgentinaArmeniaArubaAustraliaAustriaAzerbaijanBahamas, TheBahrainBangladeshBarbadosBelarusBelgiumBelizeBeninBermudaBhutanBoliviaBosnia and HerzegovinaBotswanaBrazilBrunei DarussalamBurkina FasoBurundiCabo VerdeCambodiaCameroonCanadaCaribbean small statesCayman IslandsCentral African RepublicCentral Europe and the BalticsChadChileChinaColombiaComorosCongo, Dem. Rep.Congo, Rep.Costa RicaCote d'IvoireCroatiaCubaCyprusCzech RepublicDenmarkDjiboutiDominicaDominican RepublicEarly-demographic dividendEast Asia & PacificEast Asia & Pacific (excluding high income)East Asia & Pacific (IDA & IBRD countries)EcuadorEgypt, Arab Rep.El SalvadorEquatorial GuineaEritreaEstoniaEthiopiaEuro areaEurope & Central AsiaEurope & Central Asia (excluding high income)Europe & Central Asia (IDA & IBRD countries)European UnionFaroe IslandsFijiFinlandFragile and conflict affected situationsFranceGabonGambia, TheGeorgiaGermanyGhanaGreeceGrenadaGuatemalaGuineaGuinea-BissauGuyanaHeavily indebted poor countries (HIPC)High incomeHondurasHong Kong SAR, ChinaHungaryIBRD onlyIcelandIDA & IBRD totalIDA blendIDA onlyIDA totalIndiaIndonesiaIran, Islamic Rep.IrelandItalyJamaicaJapanJordanKazakhstanKenyaKiribatiKorea, Rep.KosovoKuwaitKyrgyz RepublicLao PDRLate-demographic dividendLatin America & Caribbean Latin America & Caribbean (excluding high income)Latin America & the Caribbean (IDA & IBRD countries)LatviaLeast developed countries: UN classificationLebanonLesothoLibyaLithuaniaLow & middle incomeLow incomeLower middle incomeLuxembourgMacao SAR, ChinaMacedonia, FYRMadagascarMalawiMalaysiaMaldivesMaliMaltaMarshall IslandsMauritaniaMauritiusMexicoMicronesia, Fed. Sts.Middle East & North AfricaMiddle East & North Africa (excluding high income)Middle East & North Africa (IDA & IBRD countries)Middle incomeMoldovaMongoliaMontenegroMoroccoMozambiqueMyanmarNamibiaNepalNetherlandsNew CaledoniaNew ZealandNicaraguaNigerNigeriaNorth AmericaNorwayOECD membersOmanOther small statesPacific island small statesPakistanPalauPanamaPapua New GuineaParaguayPeruPhilippinesPolandPortugalPost-demographic dividendPre-demographic dividendPuerto RicoQatarRomaniaRussian FederationRwandaSao Tome and PrincipeSaudi ArabiaSenegalSerbiaSeychellesSierra LeoneSingaporeSlovak RepublicSloveniaSmall statesSolomon IslandsSomaliaSouth AfricaSouth AsiaSouth Asia (IDA & IBRD)SpainSri LankaSt. Kitts and NevisSt. LuciaSt. Vincent and the GrenadinesSub-Saharan Africa Sub-Saharan Africa (excluding high income)Sub-Saharan Africa (IDA & IBRD countries)SudanSurinameSwazilandSwedenSwitzerlandSyrian Arab RepublicTajikistanTanzaniaThailandTimor-LesteTogoTongaTrinidad and TobagoTunisiaTurkeyTurkmenistanTuvaluUgandaUkraineUnited KingdomUnited StatesUpper middle incomeUruguayUzbekistanVanuatuVenezuela, RBVietnamWest Bank and GazaWorldYemen, Rep.ZambiaZimbabwe Linha do tempo:
Nesta escala de tempo está apresentado um gráfico de 1966 ano até 2016 ano Dominican Republic. Dados de 1965 ano ausente. O número de observações reais por data: 51.
Fonte (nome):
Indicadores de desenvolvimento mundial
Fonte (organização):
World Bank national accounts data, and OECD National Accounts data files.
Categorias:
Economy & Growth
Foi atualizado:
23 abr 2017 ano
Indicadores de alterações dos valores ao longo dos anos
Mínimo:
13.059
1 jan 1989 ano
Máximo:
28.359
1 jan 1992 ano
Na data de observação
Valor
Mudança absoluta
A alteração em relação ao valor anterior
1 jan 1966 ano
17.185
+17.185
0.0%
1 jan 1967 ano
20.609
+3.424
19.92%
1 jan 1968 ano
21.751
+1.142
5.54%
1 jan 1969 ano
20.079
-1.672
-7.69%
1 jan 1970 ano
21.278
+1.2
5.98%
1 jan 1971 ano
20.782
-0.497
-2.33%
1 jan 1972 ano
20.607
-0.175
-0.84%
1 jan 1973 ano
19.487
-1.12
-5.43%
1 jan 1974 ano
18.851
-0.636
-3.27%
1 jan 1975 ano
21.551
+2.7
14.32%
1 jan 1976 ano
23.747
+2.196
10.19%
1 jan 1977 ano
22.854
-0.893
-3.76%
1 jan 1978 ano
21.041
-1.812
-7.93%
1 jan 1979 ano
19.987
-1.054
-5.01%
1 jan 1980 ano
18.413
-1.574
-7.87%
1 jan 1981 ano
16.574
-1.839
-9.99%
1 jan 1982 ano
16.845
+0.271
1.63%
1 jan 1983 ano
19.423
+2.578
15.31%
1 jan 1984 ano
18.974
-0.45
-2.31%
1 jan 1985 ano
17.901
-1.073
-5.65%
1 jan 1986 ano
13.534
-4.367
-24.4%
1 jan 1987 ano
13.945
+0.411
3.04%
1 jan 1988 ano
13.792
-0.153
-1.1%
1 jan 1989 ano
13.059
-0.733
-5.32%
1 jan 1990 ano
19.049
+5.99
45.87%
1 jan 1991 ano
19.415
+0.366
1.92%
1 jan 1992 ano
28.359
+8.943
46.06%
1 jan 1993 ano
27.432
-0.927
-3.27%
1 jan 1994 ano
26.647
-0.784
-2.86%
1 jan 1995 ano
26.517
-0.13
-0.49%
1 jan 1996 ano
25.556
-0.961
-3.62%
1 jan 1997 ano
26.927
+1.371
5.36%
1 jan 1998 ano
26.595
-0.333
-1.24%
1 jan 1999 ano
26.737
+0.143
0.54%
1 jan 2000 ano
26.718
-0.019
-0.07%
1 jan 2001 ano
26.132
-0.586
-2.19%
1 jan 2002 ano
24.938
-1.194
-4.57%
1 jan 2003 ano
25.391
+0.453
1.82%
1 jan 2004 ano
25.445
+0.054
0.21%
1 jan 2005 ano
24.948
-0.497
-1.95%
1 jan 2006 ano
22.867
-2.081
-8.34%
1 jan 2007 ano
22.083
-0.784
-3.43%
1 jan 2008 ano
17.642
-4.441
-20.11%
1 jan 2009 ano
17.391
-0.251
-1.42%
1 jan 2010 ano
16.516
-0.875
-5.03%
1 jan 2011 ano
16.391
-0.125
-0.76%
1 jan 2012 ano
16.134
-0.257
-1.57%
1 jan 2013 ano
16.008
-0.126
-0.78%
1 jan 2014 ano
15.803
-0.205
-1.28%
1 jan 2015 ano
15.493
-0.31
-1.96%
1 jan 2016 ano
15.254
-0.239
-1.54%
Classificação de países por estatísticas atuais por anos


Comentários: