29
/pt/
pt
AIzaSyAYiBZKx7MnpbEhh9jyipgxe19OcubqV5w
April 1, 2024
238460
Seychelles
SYC
true
2
1
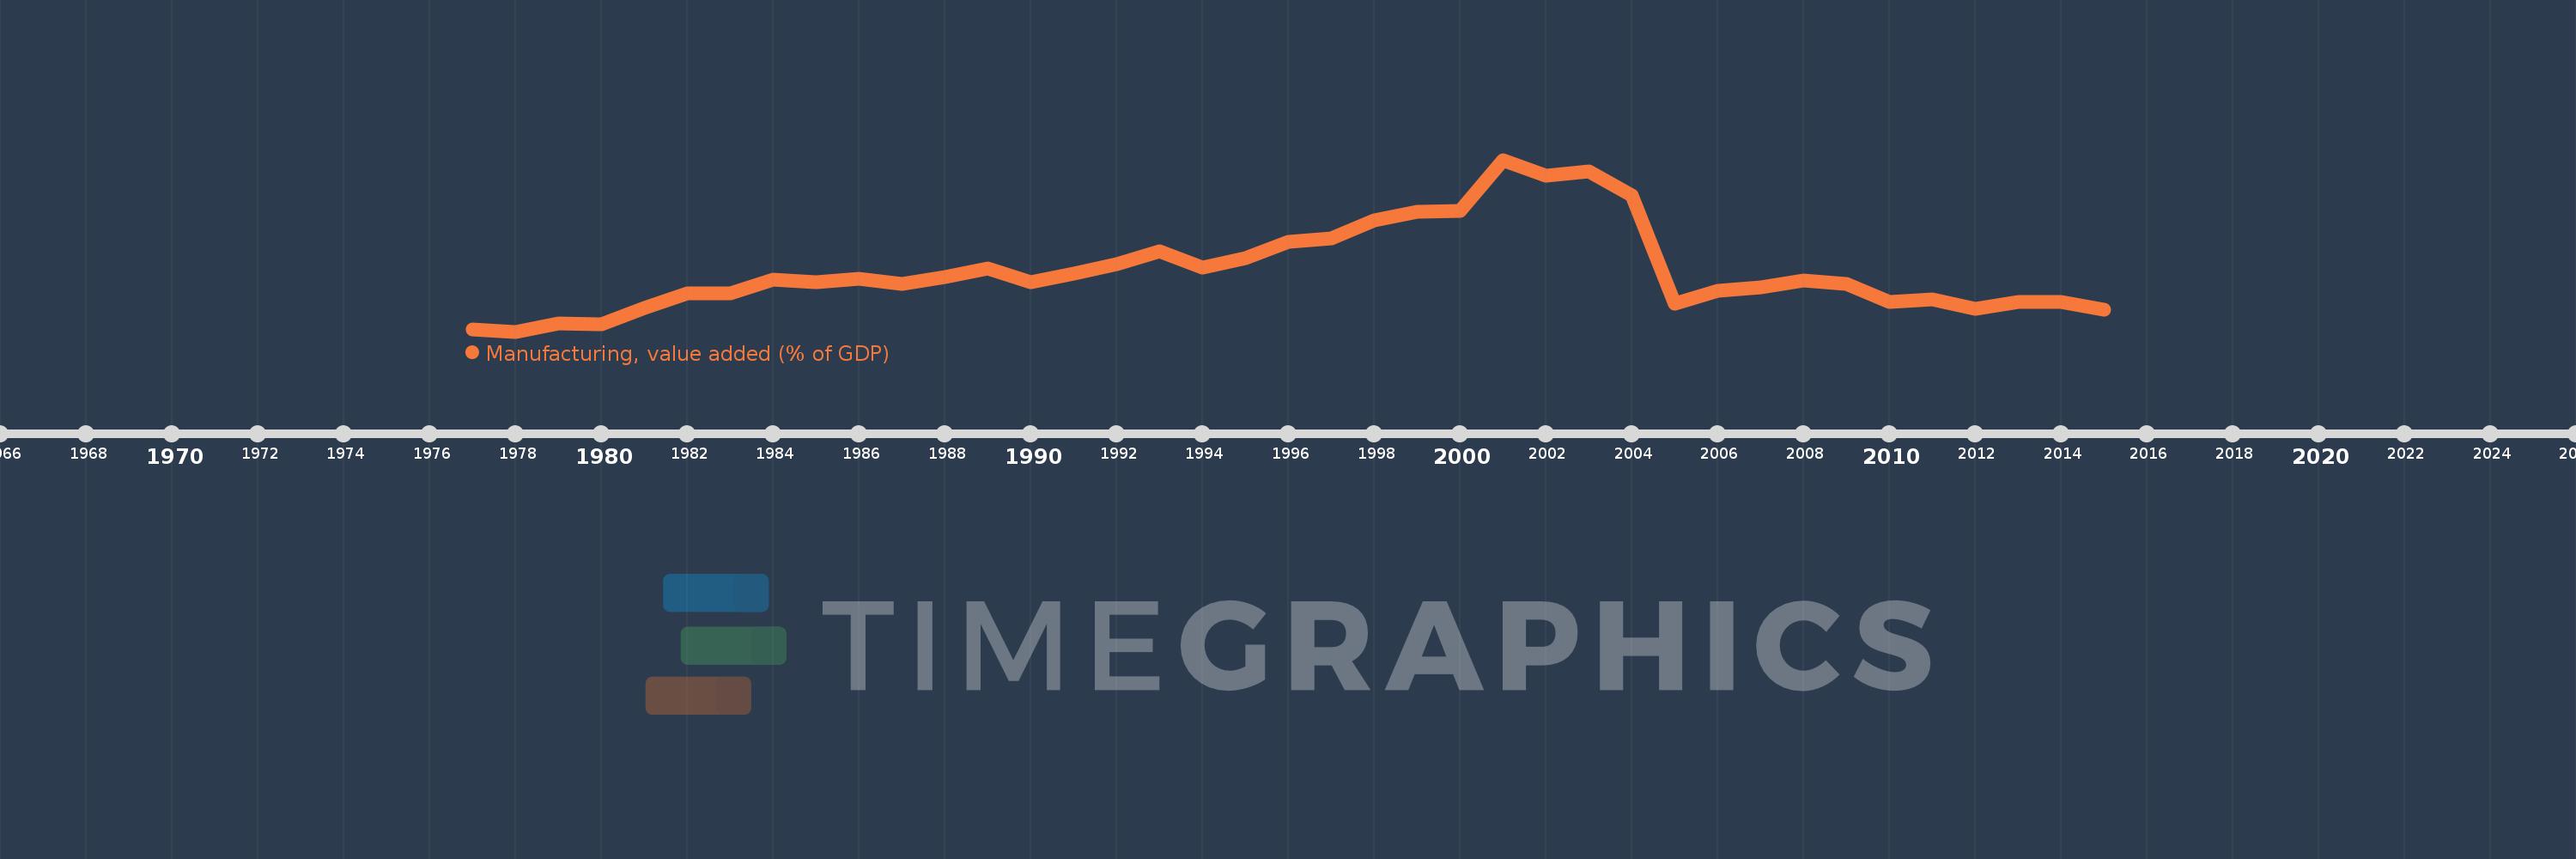
Manufacturing, value added (% of GDP)
2015,2014,2013,2012,2011,2010,2009,2008,2007,2006,2005,2004,2003,2002,2001,2000,1999,1998,1997,1996,1995,1994,1993,1992,1991,1990,1989,1988,1987,1986,1985,1984,1983,1982,1981,1980,1979,1978,1977
Estas estatísticas em outros países:
AfghanistanAlbaniaAlgeriaAndorraAngolaAntigua and BarbudaArab WorldArgentinaArmeniaArubaAustraliaAustriaAzerbaijanBahamas, TheBahrainBangladeshBarbadosBelarusBelgiumBelizeBeninBermudaBhutanBoliviaBosnia and HerzegovinaBotswanaBrazilBrunei DarussalamBurkina FasoBurundiCabo VerdeCambodiaCameroonCanadaCaribbean small statesCayman IslandsCentral African RepublicCentral Europe and the BalticsChadChileChinaColombiaComorosCongo, Dem. Rep.Congo, Rep.Costa RicaCote d'IvoireCroatiaCubaCyprusCzech RepublicDenmarkDjiboutiDominicaDominican RepublicEarly-demographic dividendEast Asia & PacificEast Asia & Pacific (excluding high income)East Asia & Pacific (IDA & IBRD countries)EcuadorEgypt, Arab Rep.El SalvadorEquatorial GuineaEritreaEstoniaEthiopiaEuro areaEurope & Central AsiaEurope & Central Asia (excluding high income)Europe & Central Asia (IDA & IBRD countries)European UnionFaroe IslandsFijiFinlandFragile and conflict affected situationsFranceGabonGambia, TheGeorgiaGermanyGhanaGreeceGrenadaGuatemalaGuineaGuinea-BissauGuyanaHeavily indebted poor countries (HIPC)High incomeHondurasHong Kong SAR, ChinaHungaryIBRD onlyIcelandIDA & IBRD totalIDA blendIDA onlyIDA totalIndiaIndonesiaIran, Islamic Rep.IrelandItalyJamaicaJapanJordanKazakhstanKenyaKiribatiKorea, Rep.KosovoKuwaitKyrgyz RepublicLao PDRLate-demographic dividendLatin America & Caribbean Latin America & Caribbean (excluding high income)Latin America & the Caribbean (IDA & IBRD countries)LatviaLeast developed countries: UN classificationLebanonLesothoLibyaLithuaniaLow & middle incomeLow incomeLower middle incomeLuxembourgMacao SAR, ChinaMacedonia, FYRMadagascarMalawiMalaysiaMaldivesMaliMaltaMarshall IslandsMauritaniaMauritiusMexicoMicronesia, Fed. Sts.Middle East & North AfricaMiddle East & North Africa (excluding high income)Middle East & North Africa (IDA & IBRD countries)Middle incomeMoldovaMongoliaMontenegroMoroccoMozambiqueMyanmarNamibiaNepalNetherlandsNew CaledoniaNew ZealandNicaraguaNigerNigeriaNorth AmericaNorwayOECD membersOmanOther small statesPacific island small statesPakistanPalauPanamaPapua New GuineaParaguayPeruPhilippinesPolandPortugalPost-demographic dividendPre-demographic dividendPuerto RicoQatarRomaniaRussian FederationRwandaSao Tome and PrincipeSaudi ArabiaSenegalSerbiaSeychellesSierra LeoneSingaporeSlovak RepublicSloveniaSmall statesSolomon IslandsSomaliaSouth AfricaSouth AsiaSouth Asia (IDA & IBRD)SpainSri LankaSt. Kitts and NevisSt. LuciaSt. Vincent and the GrenadinesSub-Saharan Africa Sub-Saharan Africa (excluding high income)Sub-Saharan Africa (IDA & IBRD countries)SudanSurinameSwazilandSwedenSwitzerlandSyrian Arab RepublicTajikistanTanzaniaThailandTimor-LesteTogoTongaTrinidad and TobagoTunisiaTurkeyTurkmenistanTuvaluUgandaUkraineUnited KingdomUnited StatesUpper middle incomeUruguayUzbekistanVanuatuVenezuela, RBVietnamWest Bank and GazaWorldYemen, Rep.ZambiaZimbabwe Linha do tempo:
Nesta escala de tempo está apresentado um gráfico de 1977 ano até 2015 ano Seychelles. Dados de 1976 ano ausente. O número de observações reais por data: 39.
Fonte (nome):
Indicadores de desenvolvimento mundial
Fonte (organização):
World Bank national accounts data, and OECD National Accounts data files.
Categorias:
Economy & Growth
Foi atualizado:
23 abr 2017 ano
Indicadores de alterações dos valores ao longo dos anos
Mínimo:
5.454
1 jan 1978 ano
Máximo:
19.21
1 jan 2001 ano
Na data de observação
Valor
Mudança absoluta
A alteração em relação ao valor anterior
1 jan 1977 ano
5.652
+5.652
0.0%
1 jan 1978 ano
5.454
-0.198
-3.5%
1 jan 1979 ano
6.12
+0.666
12.2%
1 jan 1980 ano
6.043
-0.077
-1.25%
1 jan 1981 ano
7.379
+1.336
22.1%
1 jan 1982 ano
8.526
+1.147
15.55%
1 jan 1983 ano
8.522
-0.003
-0.04%
1 jan 1984 ano
9.628
+1.106
12.98%
1 jan 1985 ano
9.391
-0.238
-2.47%
1 jan 1986 ano
9.661
+0.27
2.88%
1 jan 1987 ano
9.269
-0.392
-4.05%
1 jan 1988 ano
9.793
+0.524
5.65%
1 jan 1989 ano
10.497
+0.704
7.19%
1 jan 1990 ano
9.431
-1.067
-10.16%
1 jan 1991 ano
10.096
+0.666
7.06%
1 jan 1992 ano
10.823
+0.727
7.2%
1 jan 1993 ano
11.899
+1.076
9.94%
1 jan 1994 ano
10.568
-1.331
-11.19%
1 jan 1995 ano
11.332
+0.764
7.23%
1 jan 1996 ano
12.661
+1.329
11.72%
1 jan 1997 ano
12.923
+0.262
2.07%
1 jan 1998 ano
14.377
+1.454
11.25%
1 jan 1999 ano
15.06
+0.683
4.75%
1 jan 2000 ano
15.125
+0.065
0.43%
1 jan 2001 ano
19.21
+4.085
27.01%
1 jan 2002 ano
17.965
-1.245
-6.48%
1 jan 2003 ano
18.261
+0.296
1.65%
1 jan 2004 ano
16.351
-1.909
-10.46%
1 jan 2005 ano
7.658
-8.694
-53.17%
1 jan 2006 ano
8.743
+1.085
14.17%
1 jan 2007 ano
8.963
+0.22
2.51%
1 jan 2008 ano
9.574
+0.611
6.81%
1 jan 2009 ano
9.294
-0.28
-2.92%
1 jan 2010 ano
7.824
-1.47
-15.81%
1 jan 2011 ano
8.032
+0.208
2.66%
1 jan 2012 ano
7.308
-0.724
-9.02%
1 jan 2013 ano
7.829
+0.521
7.14%
1 jan 2014 ano
7.802
-0.028
-0.35%
1 jan 2015 ano
7.241
-0.56
-7.18%
Classificação de países por estatísticas atuais por anos


Comentários: