29
/pt/
pt
AIzaSyAYiBZKx7MnpbEhh9jyipgxe19OcubqV5w
April 1, 2024
132232
Fiji
FJI
true
2
1
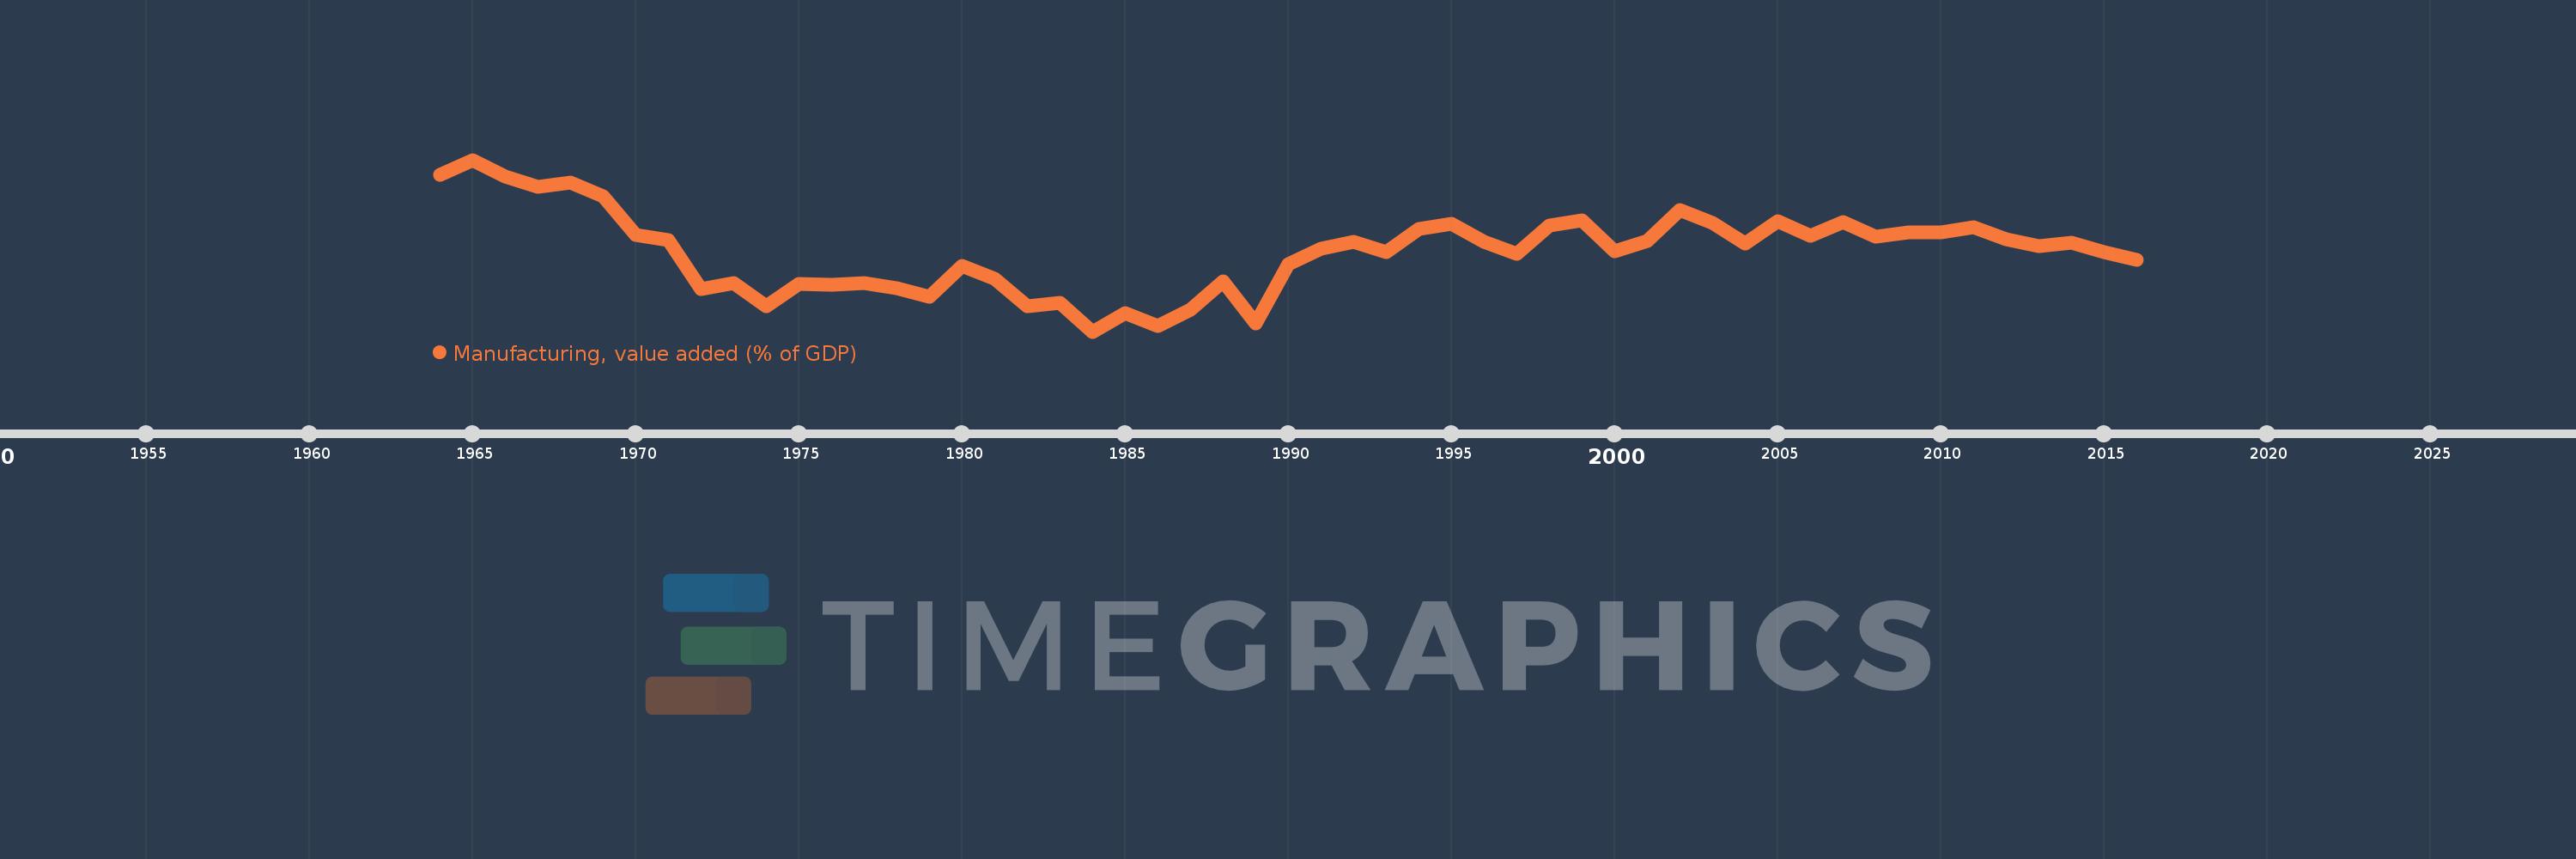
Manufacturing, value added (% of GDP)
2016,2015,2014,2013,2012,2011,2010,2009,2008,2007,2006,2005,2004,2003,2002,2001,2000,1999,1998,1997,1996,1995,1994,1993,1992,1991,1990,1989,1988,1987,1986,1985,1984,1983,1982,1981,1980,1979,1978,1977,1976,1975,1974,1973,1972,1971,1970,1969,1968,1967,1966,1965,1964
Estas estatísticas em outros países:
AfghanistanAlbaniaAlgeriaAndorraAngolaAntigua and BarbudaArab WorldArgentinaArmeniaArubaAustraliaAustriaAzerbaijanBahamas, TheBahrainBangladeshBarbadosBelarusBelgiumBelizeBeninBermudaBhutanBoliviaBosnia and HerzegovinaBotswanaBrazilBrunei DarussalamBurkina FasoBurundiCabo VerdeCambodiaCameroonCanadaCaribbean small statesCayman IslandsCentral African RepublicCentral Europe and the BalticsChadChileChinaColombiaComorosCongo, Dem. Rep.Congo, Rep.Costa RicaCote d'IvoireCroatiaCubaCyprusCzech RepublicDenmarkDjiboutiDominicaDominican RepublicEarly-demographic dividendEast Asia & PacificEast Asia & Pacific (excluding high income)East Asia & Pacific (IDA & IBRD countries)EcuadorEgypt, Arab Rep.El SalvadorEquatorial GuineaEritreaEstoniaEthiopiaEuro areaEurope & Central AsiaEurope & Central Asia (excluding high income)Europe & Central Asia (IDA & IBRD countries)European UnionFaroe IslandsFijiFinlandFragile and conflict affected situationsFranceGabonGambia, TheGeorgiaGermanyGhanaGreeceGrenadaGuatemalaGuineaGuinea-BissauGuyanaHeavily indebted poor countries (HIPC)High incomeHondurasHong Kong SAR, ChinaHungaryIBRD onlyIcelandIDA & IBRD totalIDA blendIDA onlyIDA totalIndiaIndonesiaIran, Islamic Rep.IrelandItalyJamaicaJapanJordanKazakhstanKenyaKiribatiKorea, Rep.KosovoKuwaitKyrgyz RepublicLao PDRLate-demographic dividendLatin America & Caribbean Latin America & Caribbean (excluding high income)Latin America & the Caribbean (IDA & IBRD countries)LatviaLeast developed countries: UN classificationLebanonLesothoLibyaLithuaniaLow & middle incomeLow incomeLower middle incomeLuxembourgMacao SAR, ChinaMacedonia, FYRMadagascarMalawiMalaysiaMaldivesMaliMaltaMarshall IslandsMauritaniaMauritiusMexicoMicronesia, Fed. Sts.Middle East & North AfricaMiddle East & North Africa (excluding high income)Middle East & North Africa (IDA & IBRD countries)Middle incomeMoldovaMongoliaMontenegroMoroccoMozambiqueMyanmarNamibiaNepalNetherlandsNew CaledoniaNew ZealandNicaraguaNigerNigeriaNorth AmericaNorwayOECD membersOmanOther small statesPacific island small statesPakistanPalauPanamaPapua New GuineaParaguayPeruPhilippinesPolandPortugalPost-demographic dividendPre-demographic dividendPuerto RicoQatarRomaniaRussian FederationRwandaSao Tome and PrincipeSaudi ArabiaSenegalSerbiaSeychellesSierra LeoneSingaporeSlovak RepublicSloveniaSmall statesSolomon IslandsSomaliaSouth AfricaSouth AsiaSouth Asia (IDA & IBRD)SpainSri LankaSt. Kitts and NevisSt. LuciaSt. Vincent and the GrenadinesSub-Saharan Africa Sub-Saharan Africa (excluding high income)Sub-Saharan Africa (IDA & IBRD countries)SudanSurinameSwazilandSwedenSwitzerlandSyrian Arab RepublicTajikistanTanzaniaThailandTimor-LesteTogoTongaTrinidad and TobagoTunisiaTurkeyTurkmenistanTuvaluUgandaUkraineUnited KingdomUnited StatesUpper middle incomeUruguayUzbekistanVanuatuVenezuela, RBVietnamWest Bank and GazaWorldYemen, Rep.ZambiaZimbabwe Linha do tempo:
Nesta escala de tempo está apresentado um gráfico de 1964 ano até 2016 ano Fiji. Dados de 1963 ano ausente. O número de observações reais por data: 53.
Fonte (nome):
Indicadores de desenvolvimento mundial
Fonte (organização):
World Bank national accounts data, and OECD National Accounts data files.
Categorias:
Economy & Growth
Foi atualizado:
23 abr 2017 ano
Indicadores de alterações dos valores ao longo dos anos
Mínimo:
9.154
1 jan 1984 ano
Máximo:
18.273
1 jan 1965 ano
Na data de observação
Valor
Mudança absoluta
A alteração em relação ao valor anterior
1 jan 1964 ano
17.465
+17.465
0.0%
1 jan 1965 ano
18.273
+0.808
4.62%
1 jan 1966 ano
17.383
-0.89
-4.87%
1 jan 1967 ano
16.82
-0.563
-3.24%
1 jan 1968 ano
17.05
+0.23
1.37%
1 jan 1969 ano
16.358
-0.692
-4.06%
1 jan 1970 ano
14.306
-2.052
-12.54%
1 jan 1971 ano
14.032
-0.274
-1.92%
1 jan 1972 ano
11.424
-2.608
-18.59%
1 jan 1973 ano
11.714
+0.29
2.54%
1 jan 1974 ano
10.512
-1.201
-10.26%
1 jan 1975 ano
11.693
+1.181
11.23%
1 jan 1976 ano
11.641
-0.052
-0.44%
1 jan 1977 ano
11.742
+0.101
0.86%
1 jan 1978 ano
11.458
-0.284
-2.42%
1 jan 1979 ano
11.011
-0.447
-3.9%
1 jan 1980 ano
12.638
+1.627
14.78%
1 jan 1981 ano
11.942
-0.696
-5.5%
1 jan 1982 ano
10.496
-1.446
-12.11%
1 jan 1983 ano
10.668
+0.172
1.64%
1 jan 1984 ano
9.154
-1.514
-14.19%
1 jan 1985 ano
10.144
+0.99
10.82%
1 jan 1986 ano
9.453
-0.691
-6.81%
1 jan 1987 ano
10.303
+0.85
8.99%
1 jan 1988 ano
11.836
+1.533
14.88%
1 jan 1989 ano
9.574
-2.262
-19.11%
1 jan 1990 ano
12.716
+3.142
32.82%
1 jan 1991 ano
13.548
+0.832
6.54%
1 jan 1992 ano
13.941
+0.393
2.9%
1 jan 1993 ano
13.388
-0.553
-3.97%
1 jan 1994 ano
14.623
+1.235
9.23%
1 jan 1995 ano
14.895
+0.272
1.86%
1 jan 1996 ano
13.932
-0.962
-6.46%
1 jan 1997 ano
13.276
-0.657
-4.71%
1 jan 1998 ano
14.775
+1.499
11.29%
1 jan 1999 ano
15.062
+0.287
1.94%
1 jan 2000 ano
13.415
-1.646
-10.93%
1 jan 2001 ano
13.971
+0.556
4.14%
1 jan 2002 ano
15.627
+1.656
11.85%
1 jan 2003 ano
14.903
-0.724
-4.63%
1 jan 2004 ano
13.831
-1.072
-7.19%
1 jan 2005 ano
15.007
+1.175
8.5%
1 jan 2006 ano
14.227
-0.78
-5.2%
1 jan 2007 ano
14.95
+0.723
5.08%
1 jan 2008 ano
14.172
-0.778
-5.2%
1 jan 2009 ano
14.428
+0.256
1.81%
1 jan 2010 ano
14.432
+0.004
0.02%
1 jan 2011 ano
14.683
+0.251
1.74%
1 jan 2012 ano
14.064
-0.619
-4.21%
1 jan 2013 ano
13.7
-0.364
-2.59%
1 jan 2014 ano
13.881
+0.181
1.32%
1 jan 2015 ano
13.362
-0.519
-3.74%
1 jan 2016 ano
12.941
-0.422
-3.16%
Classificação de países por estatísticas atuais por anos


Comentários: