29
/pt/
pt
AIzaSyAYiBZKx7MnpbEhh9jyipgxe19OcubqV5w
April 1, 2024
35136
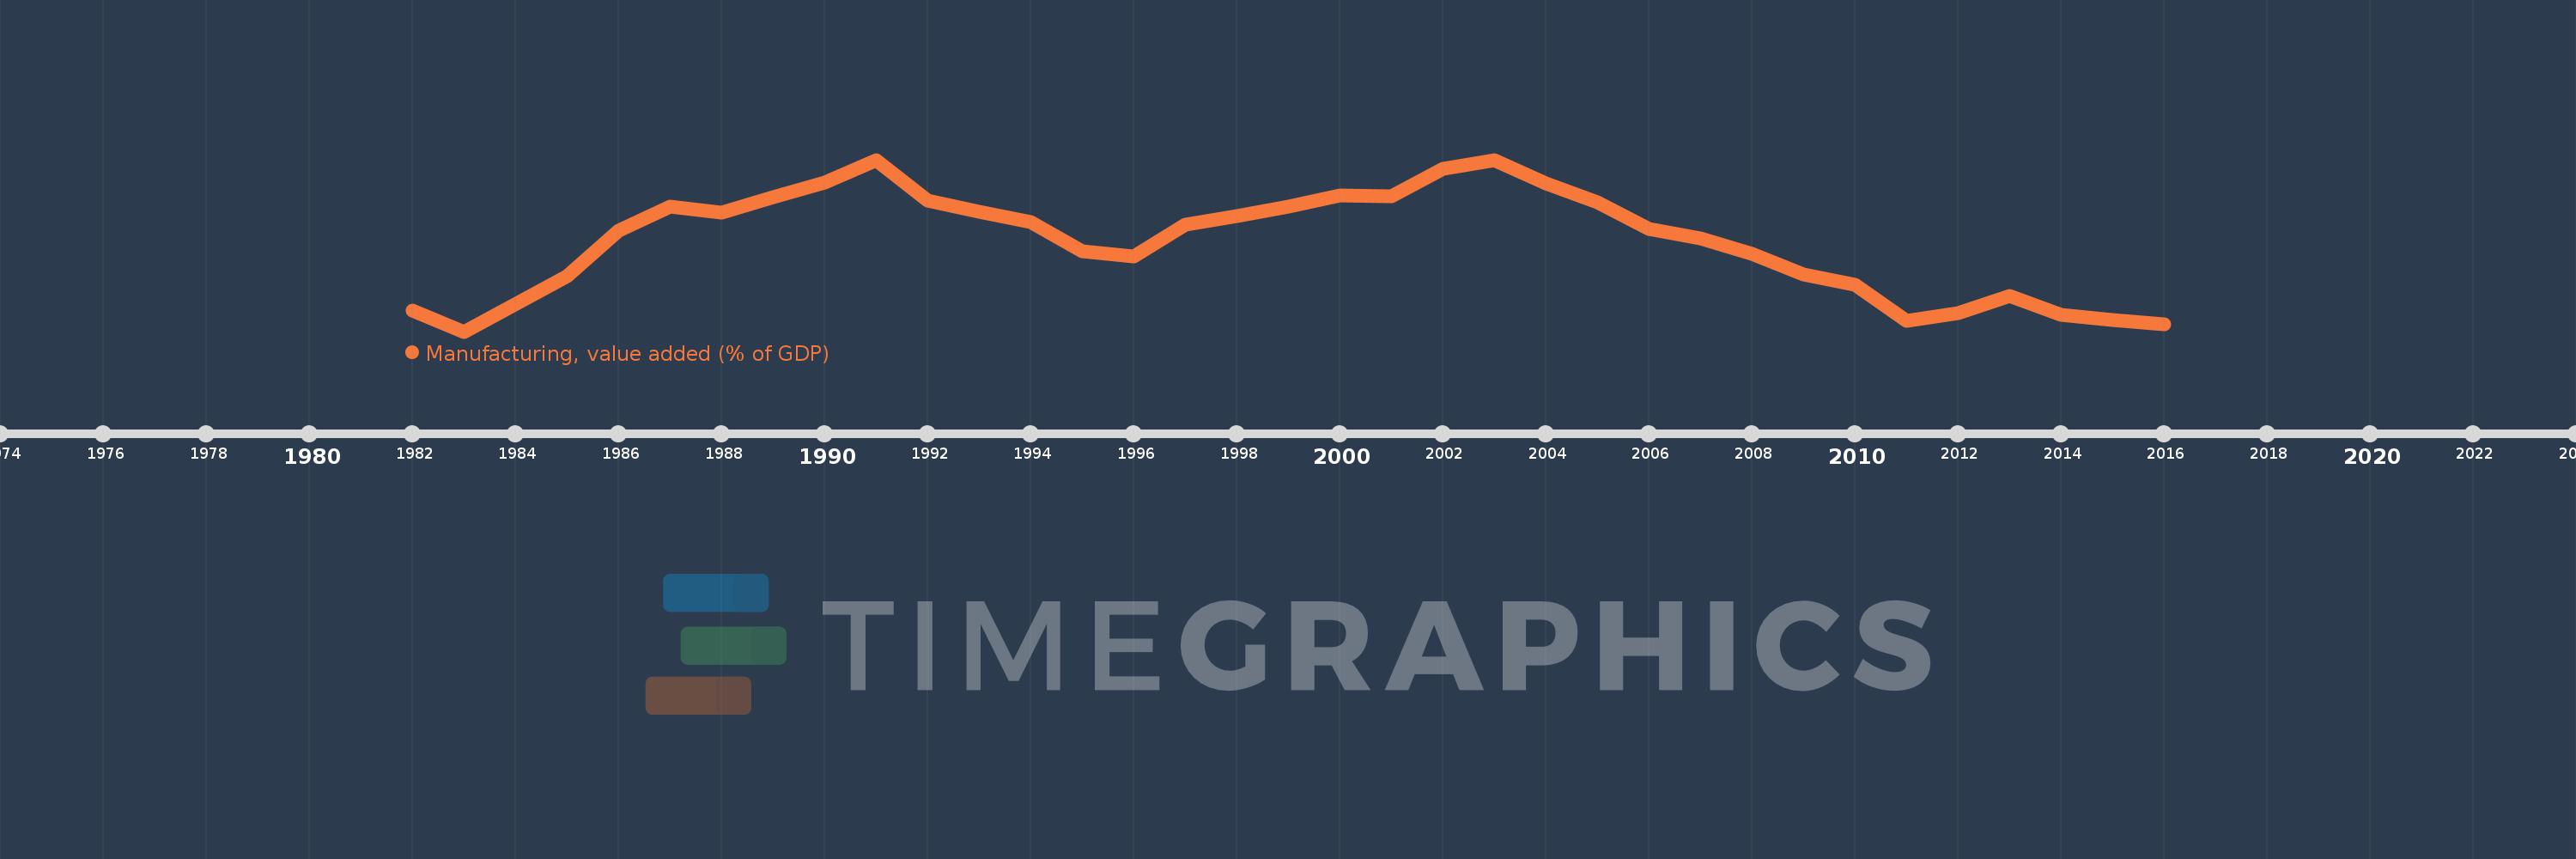
Heavily indebted poor countries (HIPC)
HPC
false
2
1
Manufacturing, value added (% of GDP)
2016,2015,2014,2013,2012,2011,2010,2009,2008,2007,2006,2005,2004,2003,2002,2001,2000,1999,1998,1997,1996,1995,1994,1993,1992,1991,1990,1989,1988,1987,1986,1985,1983,1982
Estas estatísticas em outros países:
AfghanistanAlbaniaAlgeriaAndorraAngolaAntigua and BarbudaArab WorldArgentinaArmeniaArubaAustraliaAustriaAzerbaijanBahamas, TheBahrainBangladeshBarbadosBelarusBelgiumBelizeBeninBermudaBhutanBoliviaBosnia and HerzegovinaBotswanaBrazilBrunei DarussalamBurkina FasoBurundiCabo VerdeCambodiaCameroonCanadaCaribbean small statesCayman IslandsCentral African RepublicCentral Europe and the BalticsChadChileChinaColombiaComorosCongo, Dem. Rep.Congo, Rep.Costa RicaCote d'IvoireCroatiaCubaCyprusCzech RepublicDenmarkDjiboutiDominicaDominican RepublicEarly-demographic dividendEast Asia & PacificEast Asia & Pacific (excluding high income)East Asia & Pacific (IDA & IBRD countries)EcuadorEgypt, Arab Rep.El SalvadorEquatorial GuineaEritreaEstoniaEthiopiaEuro areaEurope & Central AsiaEurope & Central Asia (excluding high income)Europe & Central Asia (IDA & IBRD countries)European UnionFaroe IslandsFijiFinlandFragile and conflict affected situationsFranceGabonGambia, TheGeorgiaGermanyGhanaGreeceGrenadaGuatemalaGuineaGuinea-BissauGuyanaHeavily indebted poor countries (HIPC)High incomeHondurasHong Kong SAR, ChinaHungaryIBRD onlyIcelandIDA & IBRD totalIDA blendIDA onlyIDA totalIndiaIndonesiaIran, Islamic Rep.IrelandItalyJamaicaJapanJordanKazakhstanKenyaKiribatiKorea, Rep.KosovoKuwaitKyrgyz RepublicLao PDRLate-demographic dividendLatin America & Caribbean Latin America & Caribbean (excluding high income)Latin America & the Caribbean (IDA & IBRD countries)LatviaLeast developed countries: UN classificationLebanonLesothoLibyaLithuaniaLow & middle incomeLow incomeLower middle incomeLuxembourgMacao SAR, ChinaMacedonia, FYRMadagascarMalawiMalaysiaMaldivesMaliMaltaMarshall IslandsMauritaniaMauritiusMexicoMicronesia, Fed. Sts.Middle East & North AfricaMiddle East & North Africa (excluding high income)Middle East & North Africa (IDA & IBRD countries)Middle incomeMoldovaMongoliaMontenegroMoroccoMozambiqueMyanmarNamibiaNepalNetherlandsNew CaledoniaNew ZealandNicaraguaNigerNigeriaNorth AmericaNorwayOECD membersOmanOther small statesPacific island small statesPakistanPalauPanamaPapua New GuineaParaguayPeruPhilippinesPolandPortugalPost-demographic dividendPre-demographic dividendPuerto RicoQatarRomaniaRussian FederationRwandaSao Tome and PrincipeSaudi ArabiaSenegalSerbiaSeychellesSierra LeoneSingaporeSlovak RepublicSloveniaSmall statesSolomon IslandsSomaliaSouth AfricaSouth AsiaSouth Asia (IDA & IBRD)SpainSri LankaSt. Kitts and NevisSt. LuciaSt. Vincent and the GrenadinesSub-Saharan Africa Sub-Saharan Africa (excluding high income)Sub-Saharan Africa (IDA & IBRD countries)SudanSurinameSwazilandSwedenSwitzerlandSyrian Arab RepublicTajikistanTanzaniaThailandTimor-LesteTogoTongaTrinidad and TobagoTunisiaTurkeyTurkmenistanTuvaluUgandaUkraineUnited KingdomUnited StatesUpper middle incomeUruguayUzbekistanVanuatuVenezuela, RBVietnamWest Bank and GazaWorldYemen, Rep.ZambiaZimbabwe Linha do tempo:
Nesta escala de tempo está apresentado um gráfico de 1982 ano até 2016 ano Heavily indebted poor countries (HIPC). Dados de 1981 ano ausente. O número de observações reais por data: 34.
Fonte (nome):
Indicadores de desenvolvimento mundial
Fonte (organização):
World Bank national accounts data, and OECD National Accounts data files.
Categorias:
Economy & Growth
Foi atualizado:
23 abr 2017 ano
Indicadores de alterações dos valores ao longo dos anos
Mínimo:
9.38
1 jan 1983 ano
Máximo:
12.201
1 jan 1991 ano
Na data de observação
Valor
Mudança absoluta
A alteração em relação ao valor anterior
1 jan 1982 ano
9.731
+9.731
0.0%
1 jan 1983 ano
9.38
-0.351
-3.6%
1 jan 1985 ano
10.29
+0.91
9.7%
1 jan 1986 ano
11.032
+0.742
7.21%
1 jan 1987 ano
11.427
+0.395
3.58%
1 jan 1988 ano
11.328
-0.099
-0.87%
1 jan 1989 ano
11.59
+0.262
2.32%
1 jan 1990 ano
11.822
+0.232
2.01%
1 jan 1991 ano
12.201
+0.378
3.2%
1 jan 1992 ano
11.531
-0.669
-5.49%
1 jan 1993 ano
11.352
-0.179
-1.56%
1 jan 1994 ano
11.177
-0.175
-1.54%
1 jan 1995 ano
10.699
-0.478
-4.27%
1 jan 1996 ano
10.614
-0.085
-0.79%
1 jan 1997 ano
11.136
+0.522
4.92%
1 jan 1998 ano
11.274
+0.138
1.24%
1 jan 1999 ano
11.431
+0.157
1.39%
1 jan 2000 ano
11.61
+0.179
1.57%
1 jan 2001 ano
11.597
-0.013
-0.11%
1 jan 2002 ano
12.05
+0.453
3.91%
1 jan 2003 ano
12.192
+0.142
1.18%
1 jan 2004 ano
11.819
-0.373
-3.06%
1 jan 2005 ano
11.496
-0.323
-2.73%
1 jan 2006 ano
11.064
-0.432
-3.76%
1 jan 2007 ano
10.908
-0.156
-1.41%
1 jan 2008 ano
10.656
-0.252
-2.31%
1 jan 2009 ano
10.315
-0.341
-3.2%
1 jan 2010 ano
10.151
-0.165
-1.6%
1 jan 2011 ano
9.556
-0.595
-5.86%
1 jan 2012 ano
9.682
+0.126
1.32%
1 jan 2013 ano
9.967
+0.285
2.95%
1 jan 2014 ano
9.656
-0.311
-3.12%
1 jan 2015 ano
9.565
-0.091
-0.94%
1 jan 2016 ano
9.499
-0.066
-0.69%
Classificação de países por estatísticas atuais por anos


Comentários: