29
/pt/
pt
AIzaSyAYiBZKx7MnpbEhh9jyipgxe19OcubqV5w
April 1, 2024
39682
IDA total
IDA
false
2
1
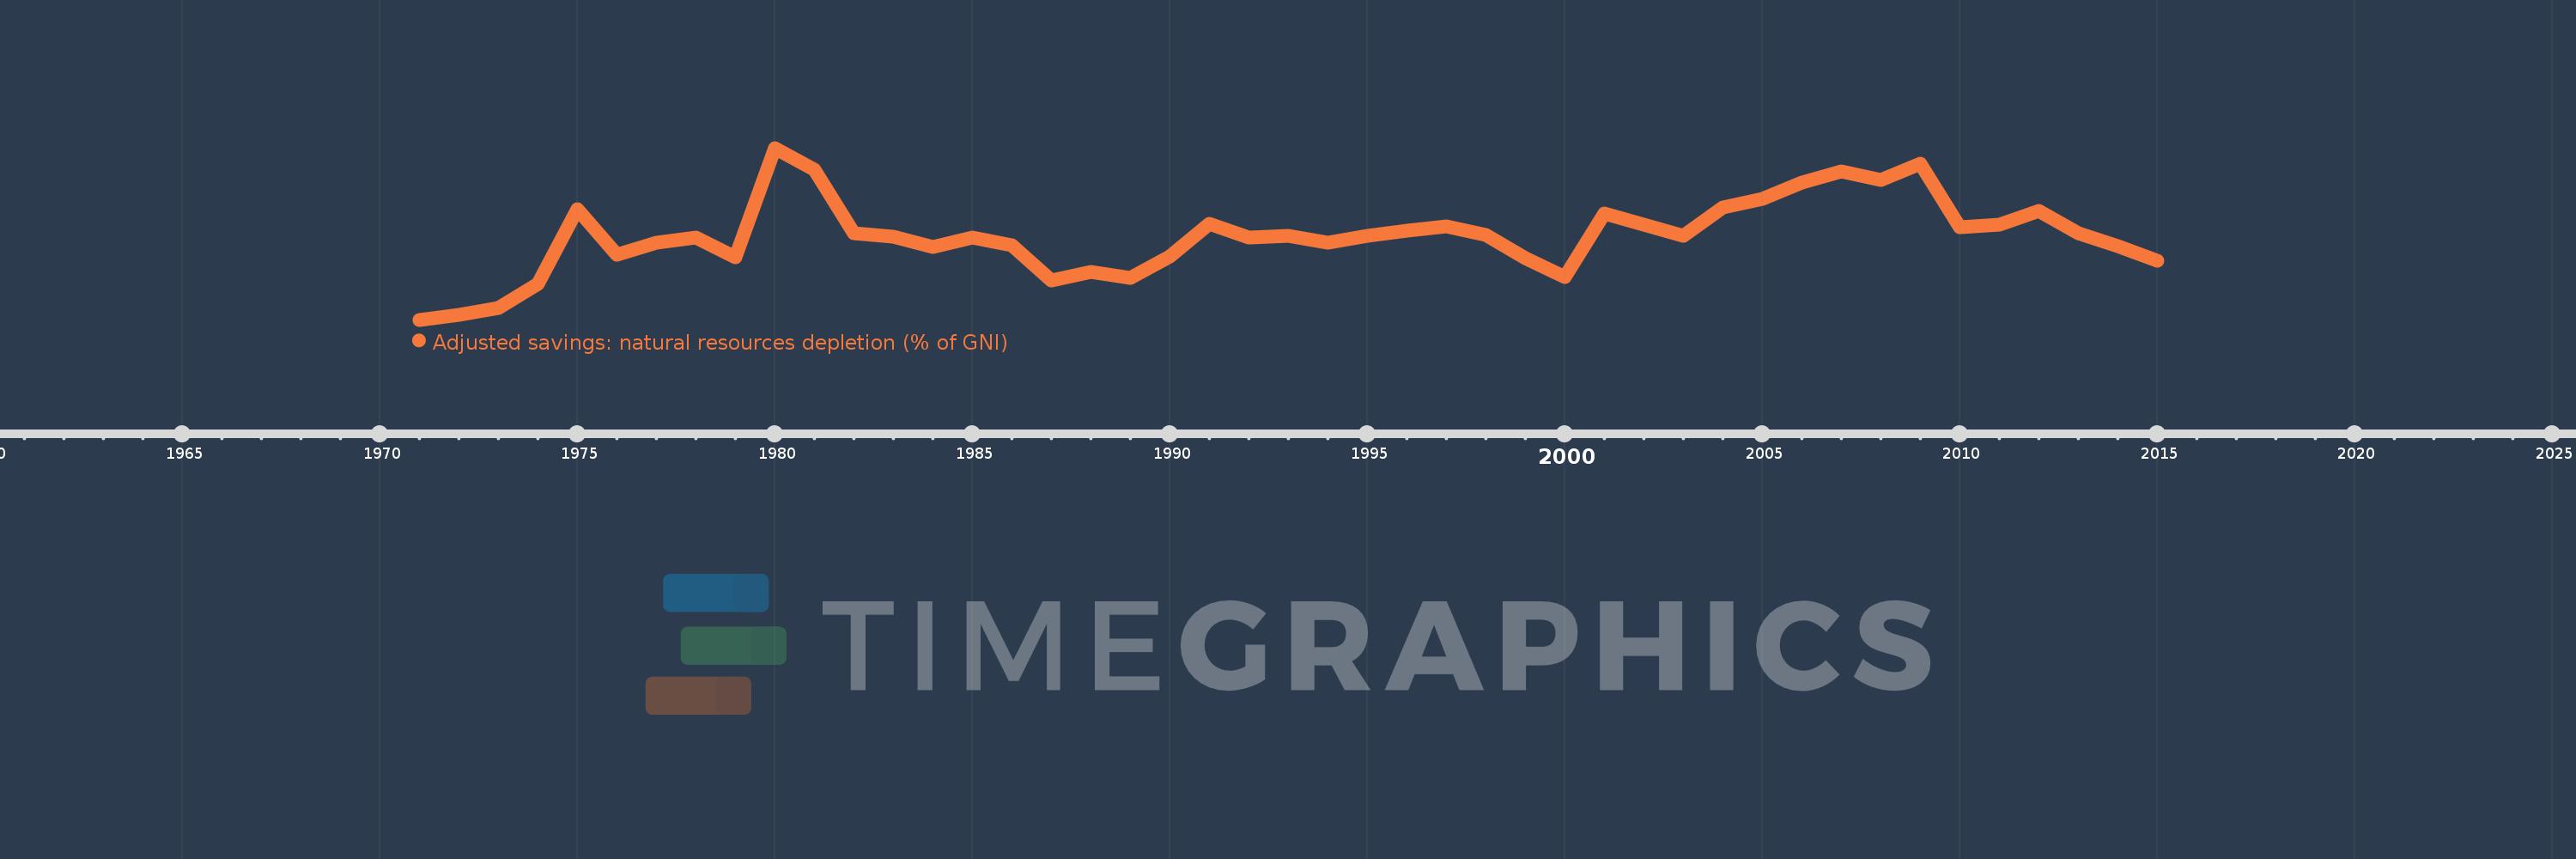
Adjusted savings: natural resources depletion (% of GNI)
2015,2014,2013,2012,2011,2010,2009,2008,2007,2006,2005,2004,2003,2002,2001,2000,1999,1998,1997,1996,1995,1994,1993,1992,1991,1990,1989,1988,1987,1986,1985,1984,1983,1982,1981,1980,1979,1978,1977,1976,1975,1974,1973,1972,1971
Estas estatísticas em outros países:
AfghanistanAlbaniaAlgeriaAngolaArab WorldArgentinaArmeniaAustraliaAustriaAzerbaijanBahamas, TheBahrainBangladeshBarbadosBelarusBelgiumBelizeBeninBhutanBoliviaBotswanaBrazilBrunei DarussalamBulgariaBurkina FasoBurundiCabo VerdeCambodiaCameroonCanadaCaribbean small statesCentral African RepublicCentral Europe and the BalticsChadChileChinaColombiaComorosCongo, Dem. Rep.Congo, Rep.Costa RicaCote d'IvoireCroatiaCubaCyprusCzech RepublicDenmarkDjiboutiDominicaDominican RepublicEarly-demographic dividendEast Asia & PacificEast Asia & Pacific (excluding high income)East Asia & Pacific (IDA & IBRD countries)EcuadorEgypt, Arab Rep.El SalvadorEquatorial GuineaEritreaEstoniaEthiopiaEuro areaEurope & Central AsiaEurope & Central Asia (excluding high income)Europe & Central Asia (IDA & IBRD countries)European UnionFijiFinlandFragile and conflict affected situationsFranceFrench PolynesiaGabonGambia, TheGeorgiaGermanyGhanaGreeceGuatemalaGuineaGuinea-BissauGuyanaHaitiHeavily indebted poor countries (HIPC)High incomeHondurasHong Kong SAR, ChinaHungaryIBRD onlyIcelandIDA & IBRD totalIDA blendIDA onlyIDA totalIndiaIndonesiaIran, Islamic Rep.IraqIrelandIsraelItalyJamaicaJapanJordanKazakhstanKenyaKiribatiKorea, Rep.KuwaitKyrgyz RepublicLao PDRLate-demographic dividendLatin America & Caribbean Latin America & Caribbean (excluding high income)Latin America & the Caribbean (IDA & IBRD countries)LatviaLeast developed countries: UN classificationLebanonLesothoLiberiaLibyaLithuaniaLow & middle incomeLow incomeLower middle incomeLuxembourgMacedonia, FYRMadagascarMalawiMalaysiaMaldivesMaliMauritaniaMauritiusMexicoMicronesia, Fed. Sts.Middle East & North AfricaMiddle East & North Africa (excluding high income)Middle East & North Africa (IDA & IBRD countries)Middle incomeMoldovaMongoliaMoroccoMozambiqueMyanmarNamibiaNepalNetherlandsNew CaledoniaNew ZealandNicaraguaNigerNigeriaNorth AmericaNorwayOECD membersOmanOther small statesPacific island small statesPakistanPanamaPapua New GuineaParaguayPeruPhilippinesPolandPortugalPost-demographic dividendPre-demographic dividendQatarRomaniaRussian FederationRwandaSamoaSao Tome and PrincipeSaudi ArabiaSenegalSeychellesSierra LeoneSingaporeSlovak RepublicSloveniaSmall statesSolomon IslandsSomaliaSouth AfricaSouth AsiaSouth Asia (IDA & IBRD)SpainSri LankaSt. LuciaSt. Vincent and the GrenadinesSub-Saharan Africa Sub-Saharan Africa (excluding high income)Sub-Saharan Africa (IDA & IBRD countries)SudanSurinameSwazilandSwedenSwitzerlandSyrian Arab RepublicTajikistanTanzaniaThailandTogoTongaTrinidad and TobagoTunisiaTurkeyTurkmenistanUgandaUkraineUnited Arab EmiratesUnited KingdomUnited StatesUpper middle incomeUruguayUzbekistanVanuatuVenezuela, RBVietnamWorldYemen, Rep.ZambiaZimbabwe Linha do tempo:
Nesta escala de tempo está apresentado um gráfico de 1971 ano até 2015 ano IDA total. Dados de 1970 ano ausente. O número de observações reais por data: 45.
Fonte (nome):
Indicadores de desenvolvimento mundial
Fonte (organização):
World Bank staff estimates based on sources and methods in World Bank's "The Changing Wealth of Nations: Measuring Sustainable Development in the New Millennium" (2011).
Categorias:
Economy & Growth, Energy & Mining
Foi atualizado:
23 abr 2017 ano
Indicadores de alterações dos valores ao longo dos anos
Mínimo:
2.05
1 jan 1971 ano
Máximo:
13.612
1 jan 1980 ano
Na data de observação
Valor
Mudança absoluta
A alteração em relação ao valor anterior
1 jan 1971 ano
2.05
+2.05
0.0%
1 jan 1972 ano
2.402
+0.353
17.2%
1 jan 1973 ano
2.816
+0.414
17.24%
1 jan 1974 ano
4.464
+1.648
58.52%
1 jan 1975 ano
9.476
+5.011
112.24%
1 jan 1976 ano
6.404
-3.072
-32.42%
1 jan 1977 ano
7.263
+0.859
13.42%
1 jan 1978 ano
7.569
+0.306
4.22%
1 jan 1979 ano
6.226
-1.343
-17.74%
1 jan 1980 ano
13.612
+7.386
118.63%
1 jan 1981 ano
12.153
-1.458
-10.71%
1 jan 1982 ano
7.856
-4.297
-35.36%
1 jan 1983 ano
7.619
-0.238
-3.03%
1 jan 1984 ano
6.94
-0.678
-8.9%
1 jan 1985 ano
7.579
+0.638
9.2%
1 jan 1986 ano
7.063
-0.515
-6.8%
1 jan 1987 ano
4.713
-2.35
-33.27%
1 jan 1988 ano
5.259
+0.546
11.58%
1 jan 1989 ano
4.871
-0.388
-7.38%
1 jan 1990 ano
6.329
+1.459
29.95%
1 jan 1991 ano
8.513
+2.184
34.5%
1 jan 1992 ano
7.556
-0.957
-11.24%
1 jan 1993 ano
7.713
+0.157
2.07%
1 jan 1994 ano
7.229
-0.484
-6.28%
1 jan 1995 ano
7.691
+0.462
6.39%
1 jan 1996 ano
8.065
+0.374
4.86%
1 jan 1997 ano
8.36
+0.295
3.66%
1 jan 1998 ano
7.764
-0.596
-7.13%
1 jan 1999 ano
6.181
-1.583
-20.39%
1 jan 2000 ano
4.929
-1.252
-20.25%
1 jan 2001 ano
9.191
+4.261
86.45%
1 jan 2002 ano
8.441
-0.75
-8.16%
1 jan 2003 ano
7.693
-0.748
-8.86%
1 jan 2004 ano
9.577
+1.884
24.49%
1 jan 2005 ano
10.2
+0.623
6.5%
1 jan 2006 ano
11.294
+1.095
10.73%
1 jan 2007 ano
12.06
+0.766
6.78%
1 jan 2008 ano
11.443
-0.617
-5.11%
1 jan 2009 ano
12.558
+1.114
9.74%
1 jan 2010 ano
8.289
-4.269
-33.99%
1 jan 2011 ano
8.471
+0.183
2.2%
1 jan 2012 ano
9.401
+0.929
10.97%
1 jan 2013 ano
7.867
-1.533
-16.31%
1 jan 2014 ano
7.018
-0.849
-10.79%
1 jan 2015 ano
5.997
-1.021
-14.55%
Classificação de países por estatísticas atuais por anos


Comentários: