29
/pt/
pt
AIzaSyAYiBZKx7MnpbEhh9jyipgxe19OcubqV5w
April 1, 2024
253843
Suriname
SUR
true
2
1
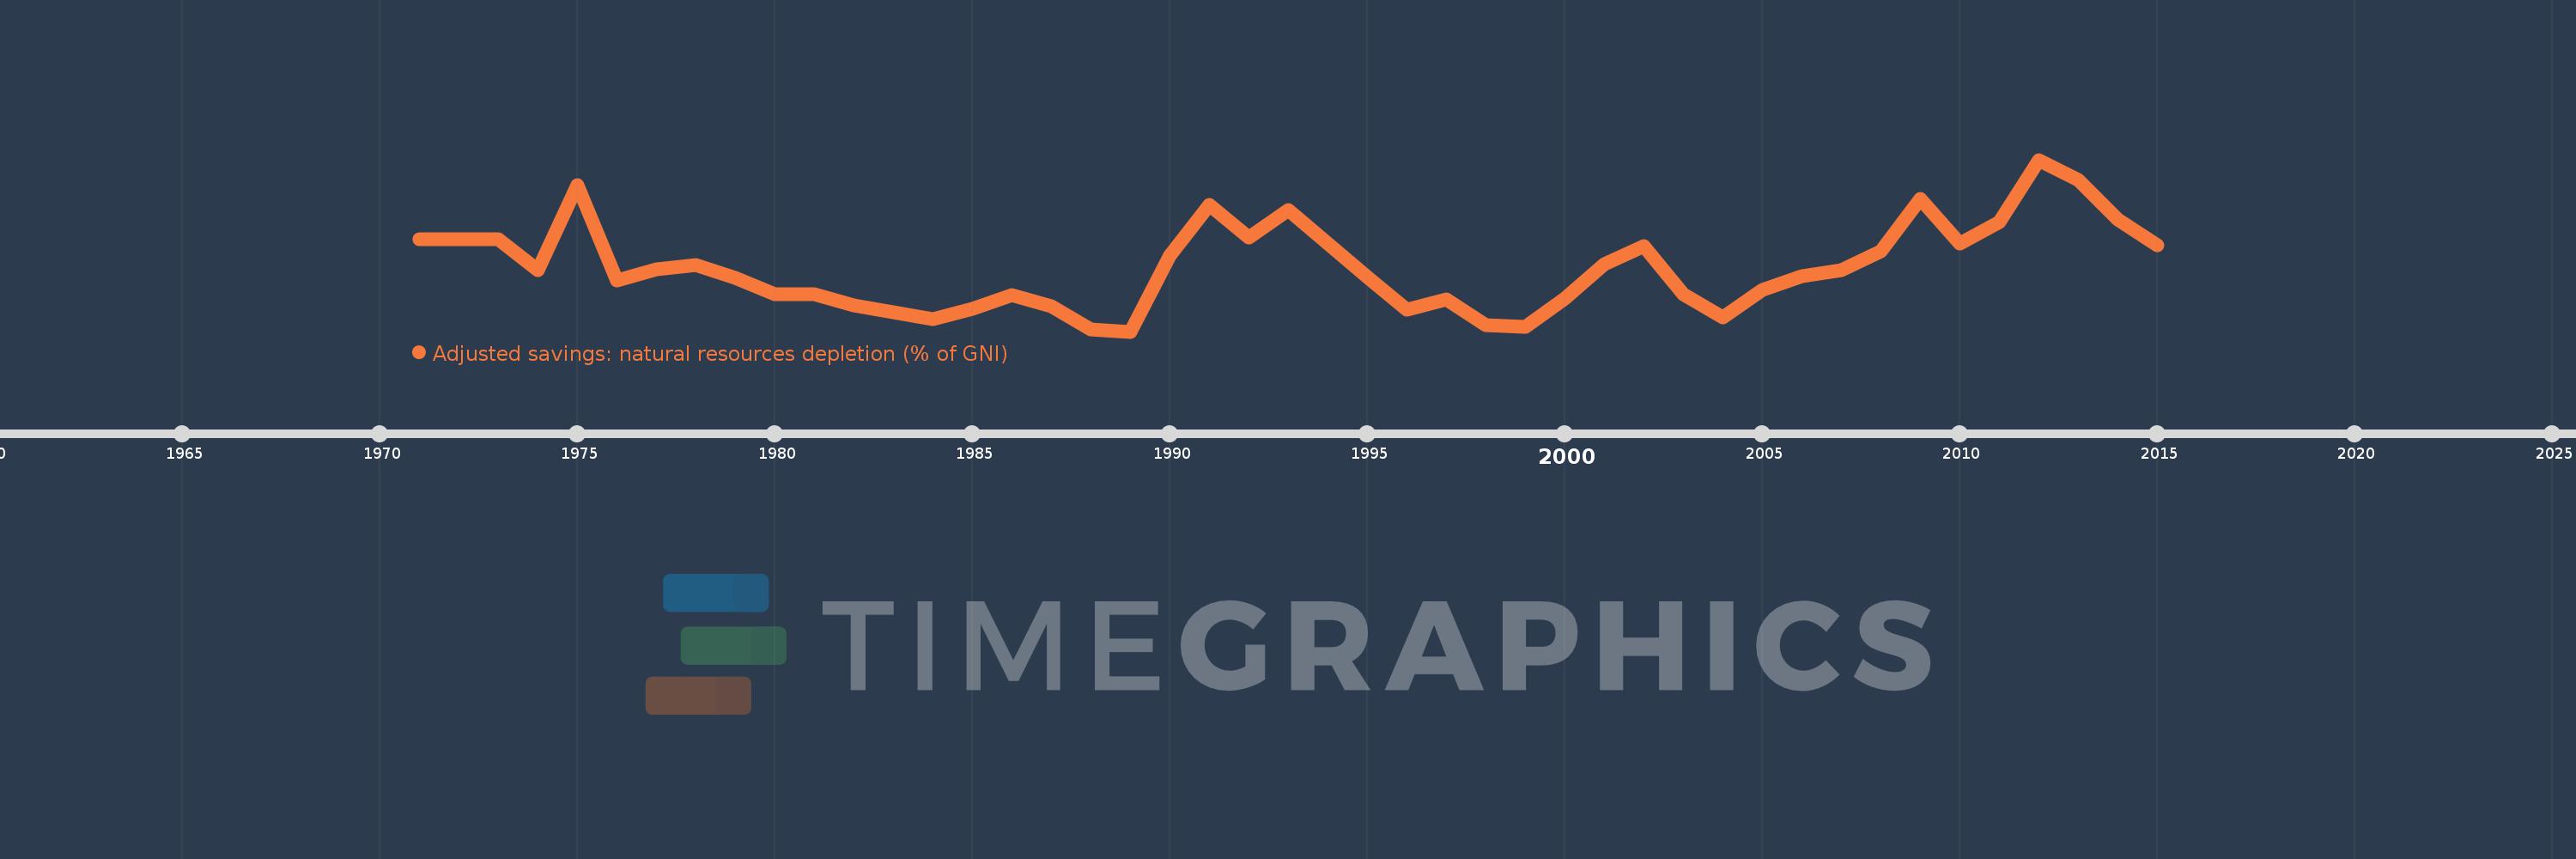
Adjusted savings: natural resources depletion (% of GNI)
2015,2014,2013,2012,2011,2010,2009,2008,2007,2006,2005,2004,2003,2002,2001,2000,1999,1998,1997,1996,1995,1993,1992,1991,1990,1989,1988,1987,1986,1985,1984,1983,1982,1981,1980,1979,1978,1977,1976,1975,1974,1973,1972,1971
Estas estatísticas em outros países:
AfghanistanAlbaniaAlgeriaAngolaArab WorldArgentinaArmeniaAustraliaAustriaAzerbaijanBahamas, TheBahrainBangladeshBarbadosBelarusBelgiumBelizeBeninBhutanBoliviaBotswanaBrazilBrunei DarussalamBulgariaBurkina FasoBurundiCabo VerdeCambodiaCameroonCanadaCaribbean small statesCentral African RepublicCentral Europe and the BalticsChadChileChinaColombiaComorosCongo, Dem. Rep.Congo, Rep.Costa RicaCote d'IvoireCroatiaCubaCyprusCzech RepublicDenmarkDjiboutiDominicaDominican RepublicEarly-demographic dividendEast Asia & PacificEast Asia & Pacific (excluding high income)East Asia & Pacific (IDA & IBRD countries)EcuadorEgypt, Arab Rep.El SalvadorEquatorial GuineaEritreaEstoniaEthiopiaEuro areaEurope & Central AsiaEurope & Central Asia (excluding high income)Europe & Central Asia (IDA & IBRD countries)European UnionFijiFinlandFragile and conflict affected situationsFranceFrench PolynesiaGabonGambia, TheGeorgiaGermanyGhanaGreeceGuatemalaGuineaGuinea-BissauGuyanaHaitiHeavily indebted poor countries (HIPC)High incomeHondurasHong Kong SAR, ChinaHungaryIBRD onlyIcelandIDA & IBRD totalIDA blendIDA onlyIDA totalIndiaIndonesiaIran, Islamic Rep.IraqIrelandIsraelItalyJamaicaJapanJordanKazakhstanKenyaKiribatiKorea, Rep.KuwaitKyrgyz RepublicLao PDRLate-demographic dividendLatin America & Caribbean Latin America & Caribbean (excluding high income)Latin America & the Caribbean (IDA & IBRD countries)LatviaLeast developed countries: UN classificationLebanonLesothoLiberiaLibyaLithuaniaLow & middle incomeLow incomeLower middle incomeLuxembourgMacedonia, FYRMadagascarMalawiMalaysiaMaldivesMaliMauritaniaMauritiusMexicoMicronesia, Fed. Sts.Middle East & North AfricaMiddle East & North Africa (excluding high income)Middle East & North Africa (IDA & IBRD countries)Middle incomeMoldovaMongoliaMoroccoMozambiqueMyanmarNamibiaNepalNetherlandsNew CaledoniaNew ZealandNicaraguaNigerNigeriaNorth AmericaNorwayOECD membersOmanOther small statesPacific island small statesPakistanPanamaPapua New GuineaParaguayPeruPhilippinesPolandPortugalPost-demographic dividendPre-demographic dividendQatarRomaniaRussian FederationRwandaSamoaSao Tome and PrincipeSaudi ArabiaSenegalSeychellesSierra LeoneSingaporeSlovak RepublicSloveniaSmall statesSolomon IslandsSomaliaSouth AfricaSouth AsiaSouth Asia (IDA & IBRD)SpainSri LankaSt. LuciaSt. Vincent and the GrenadinesSub-Saharan Africa Sub-Saharan Africa (excluding high income)Sub-Saharan Africa (IDA & IBRD countries)SudanSurinameSwazilandSwedenSwitzerlandSyrian Arab RepublicTajikistanTanzaniaThailandTogoTongaTrinidad and TobagoTunisiaTurkeyTurkmenistanUgandaUkraineUnited Arab EmiratesUnited KingdomUnited StatesUpper middle incomeUruguayUzbekistanVanuatuVenezuela, RBVietnamWorldYemen, Rep.ZambiaZimbabwe Linha do tempo:
Nesta escala de tempo está apresentado um gráfico de 1971 ano até 2015 ano Suriname. Dados de 1970 ano ausente. O número de observações reais por data: 44.
Fonte (nome):
Indicadores de desenvolvimento mundial
Fonte (organização):
World Bank staff estimates based on sources and methods in World Bank's "The Changing Wealth of Nations: Measuring Sustainable Development in the New Millennium" (2011).
Categorias:
Economy & Growth, Energy & Mining
Foi atualizado:
23 abr 2017 ano
Indicadores de alterações dos valores ao longo dos anos
Mínimo:
2.796
1 jan 1989 ano
Máximo:
16.624
1 jan 2012 ano
Na data de observação
Valor
Mudança absoluta
A alteração em relação ao valor anterior
1 jan 1971 ano
10.233
+10.233
0.0%
1 jan 1972 ano
10.226
-0.007
-0.06%
1 jan 1973 ano
10.261
+0.036
0.35%
1 jan 1974 ano
7.755
-2.507
-24.43%
1 jan 1975 ano
14.55
+6.795
87.63%
1 jan 1976 ano
6.919
-7.63
-52.44%
1 jan 1977 ano
7.786
+0.867
12.52%
1 jan 1978 ano
8.161
+0.375
4.82%
1 jan 1979 ano
7.148
-1.014
-12.42%
1 jan 1980 ano
5.786
-1.361
-19.05%
1 jan 1981 ano
5.773
-0.013
-0.23%
1 jan 1982 ano
4.873
-0.9
-15.58%
1 jan 1983 ano
4.324
-0.55
-11.28%
1 jan 1984 ano
3.785
-0.539
-12.46%
1 jan 1985 ano
4.628
+0.843
22.27%
1 jan 1986 ano
5.724
+1.096
23.68%
1 jan 1987 ano
4.845
-0.879
-15.36%
1 jan 1988 ano
2.947
-1.897
-39.16%
1 jan 1989 ano
2.796
-0.152
-5.15%
1 jan 1990 ano
8.908
+6.112
218.63%
1 jan 1991 ano
12.996
+4.088
45.9%
1 jan 1992 ano
10.336
-2.66
-20.47%
1 jan 1993 ano
12.555
+2.219
21.47%
1 jan 1995 ano
7.195
-5.36
-42.69%
1 jan 1996 ano
4.527
-2.668
-37.08%
1 jan 1997 ano
5.364
+0.837
18.49%
1 jan 1998 ano
3.343
-2.021
-37.68%
1 jan 1999 ano
3.191
-0.152
-4.56%
1 jan 2000 ano
5.471
+2.28
71.47%
1 jan 2001 ano
8.2
+2.729
49.87%
1 jan 2002 ano
9.676
+1.476
18.0%
1 jan 2003 ano
5.834
-3.842
-39.71%
1 jan 2004 ano
3.943
-1.89
-32.4%
1 jan 2005 ano
6.161
+2.218
56.25%
1 jan 2006 ano
7.258
+1.096
17.79%
1 jan 2007 ano
7.762
+0.504
6.95%
1 jan 2008 ano
9.262
+1.499
19.32%
1 jan 2009 ano
13.478
+4.216
45.52%
1 jan 2010 ano
9.913
-3.565
-26.45%
1 jan 2011 ano
11.624
+1.712
17.27%
1 jan 2012 ano
16.624
+5.0
43.01%
1 jan 2013 ano
14.987
-1.637
-9.85%
1 jan 2014 ano
11.79
-3.196
-21.33%
1 jan 2015 ano
9.754
-2.036
-17.27%
Classificação de países por estatísticas atuais por anos


Comentários: