29
/pt/
pt
AIzaSyAYiBZKx7MnpbEhh9jyipgxe19OcubqV5w
April 1, 2024
24647
Caribbean small states
CSS
false
2
1
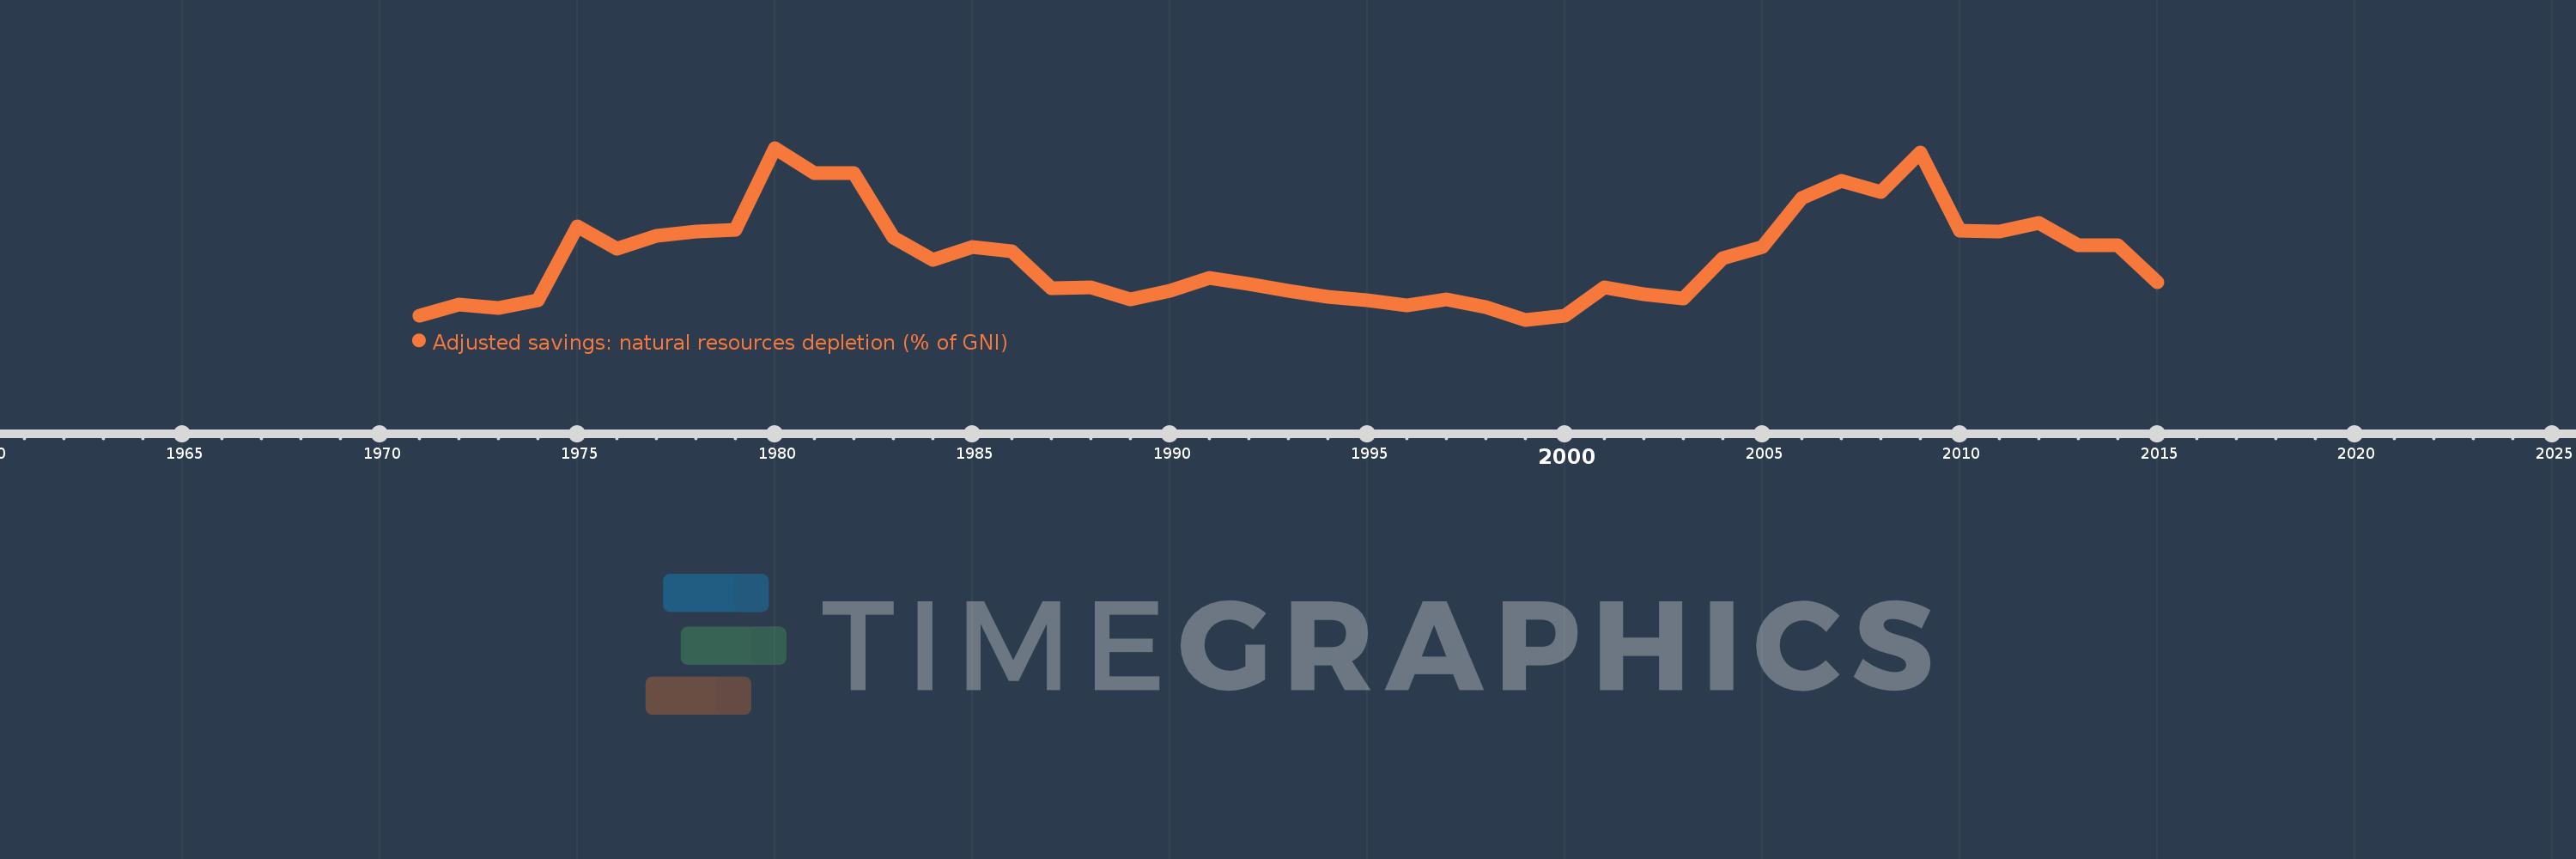
Adjusted savings: natural resources depletion (% of GNI)
2015,2014,2013,2012,2011,2010,2009,2008,2007,2006,2005,2004,2003,2002,2001,2000,1999,1998,1997,1996,1995,1994,1993,1992,1991,1990,1989,1988,1987,1986,1985,1984,1983,1982,1981,1980,1979,1978,1977,1976,1975,1974,1973,1972,1971
Estas estatísticas em outros países:
AfghanistanAlbaniaAlgeriaAngolaArab WorldArgentinaArmeniaAustraliaAustriaAzerbaijanBahamas, TheBahrainBangladeshBarbadosBelarusBelgiumBelizeBeninBhutanBoliviaBotswanaBrazilBrunei DarussalamBulgariaBurkina FasoBurundiCabo VerdeCambodiaCameroonCanadaCaribbean small statesCentral African RepublicCentral Europe and the BalticsChadChileChinaColombiaComorosCongo, Dem. Rep.Congo, Rep.Costa RicaCote d'IvoireCroatiaCubaCyprusCzech RepublicDenmarkDjiboutiDominicaDominican RepublicEarly-demographic dividendEast Asia & PacificEast Asia & Pacific (excluding high income)East Asia & Pacific (IDA & IBRD countries)EcuadorEgypt, Arab Rep.El SalvadorEquatorial GuineaEritreaEstoniaEthiopiaEuro areaEurope & Central AsiaEurope & Central Asia (excluding high income)Europe & Central Asia (IDA & IBRD countries)European UnionFijiFinlandFragile and conflict affected situationsFranceFrench PolynesiaGabonGambia, TheGeorgiaGermanyGhanaGreeceGuatemalaGuineaGuinea-BissauGuyanaHaitiHeavily indebted poor countries (HIPC)High incomeHondurasHong Kong SAR, ChinaHungaryIBRD onlyIcelandIDA & IBRD totalIDA blendIDA onlyIDA totalIndiaIndonesiaIran, Islamic Rep.IraqIrelandIsraelItalyJamaicaJapanJordanKazakhstanKenyaKiribatiKorea, Rep.KuwaitKyrgyz RepublicLao PDRLate-demographic dividendLatin America & Caribbean Latin America & Caribbean (excluding high income)Latin America & the Caribbean (IDA & IBRD countries)LatviaLeast developed countries: UN classificationLebanonLesothoLiberiaLibyaLithuaniaLow & middle incomeLow incomeLower middle incomeLuxembourgMacedonia, FYRMadagascarMalawiMalaysiaMaldivesMaliMauritaniaMauritiusMexicoMicronesia, Fed. Sts.Middle East & North AfricaMiddle East & North Africa (excluding high income)Middle East & North Africa (IDA & IBRD countries)Middle incomeMoldovaMongoliaMoroccoMozambiqueMyanmarNamibiaNepalNetherlandsNew CaledoniaNew ZealandNicaraguaNigerNigeriaNorth AmericaNorwayOECD membersOmanOther small statesPacific island small statesPakistanPanamaPapua New GuineaParaguayPeruPhilippinesPolandPortugalPost-demographic dividendPre-demographic dividendQatarRomaniaRussian FederationRwandaSamoaSao Tome and PrincipeSaudi ArabiaSenegalSeychellesSierra LeoneSingaporeSlovak RepublicSloveniaSmall statesSolomon IslandsSomaliaSouth AfricaSouth AsiaSouth Asia (IDA & IBRD)SpainSri LankaSt. LuciaSt. Vincent and the GrenadinesSub-Saharan Africa Sub-Saharan Africa (excluding high income)Sub-Saharan Africa (IDA & IBRD countries)SudanSurinameSwazilandSwedenSwitzerlandSyrian Arab RepublicTajikistanTanzaniaThailandTogoTongaTrinidad and TobagoTunisiaTurkeyTurkmenistanUgandaUkraineUnited Arab EmiratesUnited KingdomUnited StatesUpper middle incomeUruguayUzbekistanVanuatuVenezuela, RBVietnamWorldYemen, Rep.ZambiaZimbabwe Linha do tempo:
Nesta escala de tempo está apresentado um gráfico de 1971 ano até 2015 ano Caribbean small states. Dados de 1970 ano ausente. O número de observações reais por data: 45.
Fonte (nome):
Indicadores de desenvolvimento mundial
Fonte (organização):
World Bank staff estimates based on sources and methods in World Bank's "The Changing Wealth of Nations: Measuring Sustainable Development in the New Millennium" (2011).
Categorias:
Economy & Growth, Energy & Mining
Foi atualizado:
23 abr 2017 ano
Indicadores de alterações dos valores ao longo dos anos
Mínimo:
2.617
1 jan 1999 ano
Máximo:
24.108
1 jan 1980 ano
Na data de observação
Valor
Mudança absoluta
A alteração em relação ao valor anterior
1 jan 1971 ano
3.11
+3.11
0.0%
1 jan 1972 ano
4.548
+1.438
46.25%
1 jan 1973 ano
4.065
-0.484
-10.64%
1 jan 1974 ano
5.064
+1.0
24.6%
1 jan 1975 ano
14.275
+9.211
181.87%
1 jan 1976 ano
11.502
-2.773
-19.42%
1 jan 1977 ano
13.134
+1.632
14.19%
1 jan 1978 ano
13.678
+0.544
4.14%
1 jan 1979 ano
13.885
+0.207
1.51%
1 jan 1980 ano
24.108
+10.223
73.63%
1 jan 1981 ano
20.976
-3.131
-12.99%
1 jan 1982 ano
20.965
-0.011
-0.05%
1 jan 1983 ano
12.897
-8.068
-38.48%
1 jan 1984 ano
10.139
-2.759
-21.39%
1 jan 1985 ano
11.686
+1.547
15.26%
1 jan 1986 ano
11.227
-0.459
-3.93%
1 jan 1987 ano
6.593
-4.634
-41.27%
1 jan 1988 ano
6.643
+0.05
0.75%
1 jan 1989 ano
5.14
-1.503
-22.62%
1 jan 1990 ano
6.277
+1.137
22.11%
1 jan 1991 ano
7.853
+1.576
25.11%
1 jan 1992 ano
7.099
-0.754
-9.6%
1 jan 1993 ano
6.208
-0.891
-12.55%
1 jan 1994 ano
5.437
-0.771
-12.42%
1 jan 1995 ano
5.108
-0.329
-6.05%
1 jan 1996 ano
4.425
-0.683
-13.38%
1 jan 1997 ano
5.159
+0.734
16.59%
1 jan 1998 ano
4.243
-0.915
-17.74%
1 jan 1999 ano
2.617
-1.626
-38.33%
1 jan 2000 ano
3.149
+0.532
20.33%
1 jan 2001 ano
6.711
+3.562
113.1%
1 jan 2002 ano
5.836
-0.874
-13.03%
1 jan 2003 ano
5.273
-0.563
-9.64%
1 jan 2004 ano
10.33
+5.056
95.88%
1 jan 2005 ano
11.685
+1.355
13.12%
1 jan 2006 ano
17.842
+6.157
52.69%
1 jan 2007 ano
20.001
+2.159
12.1%
1 jan 2008 ano
18.647
-1.354
-6.77%
1 jan 2009 ano
23.549
+4.903
26.29%
1 jan 2010 ano
13.786
-9.763
-41.46%
1 jan 2011 ano
13.673
-0.113
-0.82%
1 jan 2012 ano
14.684
+1.011
7.4%
1 jan 2013 ano
11.955
-2.729
-18.59%
1 jan 2014 ano
11.975
+0.02
0.17%
1 jan 2015 ano
7.361
-4.614
-38.53%
Classificação de países por estatísticas atuais por anos


Comentários: