29
/pt/
pt
AIzaSyAYiBZKx7MnpbEhh9jyipgxe19OcubqV5w
April 1, 2024
133811
France
FRA
true
2
1
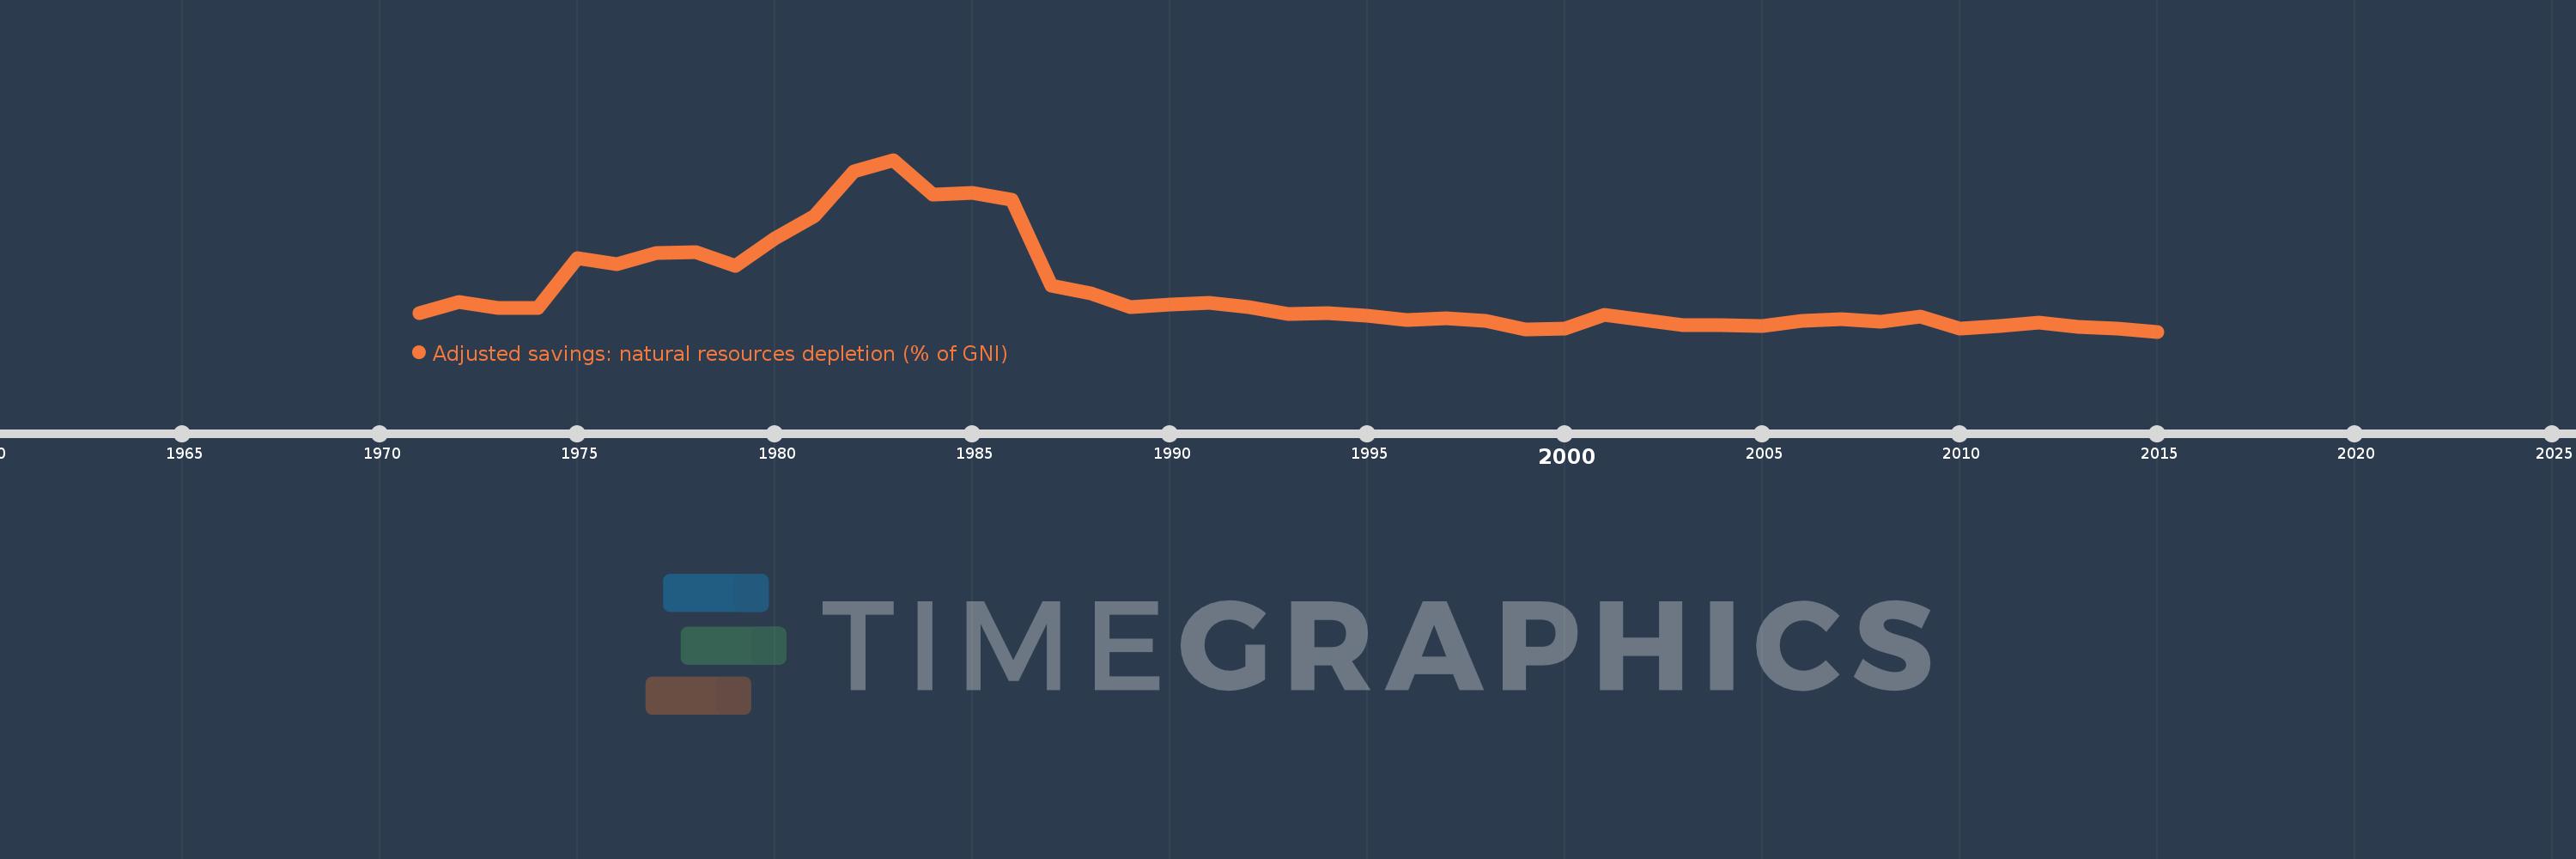
Adjusted savings: natural resources depletion (% of GNI)
2015,2014,2013,2012,2011,2010,2009,2008,2007,2006,2005,2004,2003,2002,2001,2000,1999,1998,1997,1996,1995,1994,1993,1992,1991,1990,1989,1988,1987,1986,1985,1984,1983,1982,1981,1980,1979,1978,1977,1976,1975,1974,1973,1972,1971
Estas estatísticas em outros países:
AfghanistanAlbaniaAlgeriaAngolaArab WorldArgentinaArmeniaAustraliaAustriaAzerbaijanBahamas, TheBahrainBangladeshBarbadosBelarusBelgiumBelizeBeninBhutanBoliviaBotswanaBrazilBrunei DarussalamBulgariaBurkina FasoBurundiCabo VerdeCambodiaCameroonCanadaCaribbean small statesCentral African RepublicCentral Europe and the BalticsChadChileChinaColombiaComorosCongo, Dem. Rep.Congo, Rep.Costa RicaCote d'IvoireCroatiaCubaCyprusCzech RepublicDenmarkDjiboutiDominicaDominican RepublicEarly-demographic dividendEast Asia & PacificEast Asia & Pacific (excluding high income)East Asia & Pacific (IDA & IBRD countries)EcuadorEgypt, Arab Rep.El SalvadorEquatorial GuineaEritreaEstoniaEthiopiaEuro areaEurope & Central AsiaEurope & Central Asia (excluding high income)Europe & Central Asia (IDA & IBRD countries)European UnionFijiFinlandFragile and conflict affected situationsFranceFrench PolynesiaGabonGambia, TheGeorgiaGermanyGhanaGreeceGuatemalaGuineaGuinea-BissauGuyanaHaitiHeavily indebted poor countries (HIPC)High incomeHondurasHong Kong SAR, ChinaHungaryIBRD onlyIcelandIDA & IBRD totalIDA blendIDA onlyIDA totalIndiaIndonesiaIran, Islamic Rep.IraqIrelandIsraelItalyJamaicaJapanJordanKazakhstanKenyaKiribatiKorea, Rep.KuwaitKyrgyz RepublicLao PDRLate-demographic dividendLatin America & Caribbean Latin America & Caribbean (excluding high income)Latin America & the Caribbean (IDA & IBRD countries)LatviaLeast developed countries: UN classificationLebanonLesothoLiberiaLibyaLithuaniaLow & middle incomeLow incomeLower middle incomeLuxembourgMacedonia, FYRMadagascarMalawiMalaysiaMaldivesMaliMauritaniaMauritiusMexicoMicronesia, Fed. Sts.Middle East & North AfricaMiddle East & North Africa (excluding high income)Middle East & North Africa (IDA & IBRD countries)Middle incomeMoldovaMongoliaMoroccoMozambiqueMyanmarNamibiaNepalNetherlandsNew CaledoniaNew ZealandNicaraguaNigerNigeriaNorth AmericaNorwayOECD membersOmanOther small statesPacific island small statesPakistanPanamaPapua New GuineaParaguayPeruPhilippinesPolandPortugalPost-demographic dividendPre-demographic dividendQatarRomaniaRussian FederationRwandaSamoaSao Tome and PrincipeSaudi ArabiaSenegalSeychellesSierra LeoneSingaporeSlovak RepublicSloveniaSmall statesSolomon IslandsSomaliaSouth AfricaSouth AsiaSouth Asia (IDA & IBRD)SpainSri LankaSt. LuciaSt. Vincent and the GrenadinesSub-Saharan Africa Sub-Saharan Africa (excluding high income)Sub-Saharan Africa (IDA & IBRD countries)SudanSurinameSwazilandSwedenSwitzerlandSyrian Arab RepublicTajikistanTanzaniaThailandTogoTongaTrinidad and TobagoTunisiaTurkeyTurkmenistanUgandaUkraineUnited Arab EmiratesUnited KingdomUnited StatesUpper middle incomeUruguayUzbekistanVanuatuVenezuela, RBVietnamWorldYemen, Rep.ZambiaZimbabwe Linha do tempo:
Nesta escala de tempo está apresentado um gráfico de 1971 ano até 2015 ano France. Dados de 1970 ano ausente. O número de observações reais por data: 45.
Fonte (nome):
Indicadores de desenvolvimento mundial
Fonte (organização):
World Bank staff estimates based on sources and methods in World Bank's "The Changing Wealth of Nations: Measuring Sustainable Development in the New Millennium" (2011).
Categorias:
Economy & Growth, Energy & Mining
Foi atualizado:
23 abr 2017 ano
Indicadores de alterações dos valores ao longo dos anos
Mínimo:
0.01
1 jan 2015 ano
Máximo:
0.185
1 jan 1983 ano
Na data de observação
Valor
Mudança absoluta
A alteração em relação ao valor anterior
1 jan 1971 ano
0.029
+0.029
0.0%
1 jan 1972 ano
0.04
+0.011
38.89%
1 jan 1973 ano
0.034
-0.005
-13.68%
1 jan 1974 ano
0.034
0.0
-0.81%
1 jan 1975 ano
0.085
+0.051
148.43%
1 jan 1976 ano
0.079
-0.005
-6.38%
1 jan 1977 ano
0.09
+0.011
13.5%
1 jan 1978 ano
0.091
+0.001
1.13%
1 jan 1979 ano
0.077
-0.014
-15.63%
1 jan 1980 ano
0.105
+0.029
37.6%
1 jan 1981 ano
0.128
+0.023
21.79%
1 jan 1982 ano
0.173
+0.044
34.36%
1 jan 1983 ano
0.185
+0.012
7.14%
1 jan 1984 ano
0.15
-0.035
-18.97%
1 jan 1985 ano
0.151
+0.001
0.88%
1 jan 1986 ano
0.144
-0.007
-4.47%
1 jan 1987 ano
0.057
-0.087
-60.54%
1 jan 1988 ano
0.049
-0.008
-14.84%
1 jan 1989 ano
0.035
-0.014
-28.62%
1 jan 1990 ano
0.038
+0.004
10.64%
1 jan 1991 ano
0.039
+0.001
2.81%
1 jan 1992 ano
0.035
-0.005
-12.39%
1 jan 1993 ano
0.028
-0.006
-18.74%
1 jan 1994 ano
0.029
+0.001
4.25%
1 jan 1995 ano
0.026
-0.003
-10.85%
1 jan 1996 ano
0.022
-0.004
-15.7%
1 jan 1997 ano
0.024
+0.002
10.42%
1 jan 1998 ano
0.021
-0.003
-11.73%
1 jan 1999 ano
0.012
-0.009
-43.22%
1 jan 2000 ano
0.013
+0.0
3.99%
1 jan 2001 ano
0.027
+0.014
113.17%
1 jan 2002 ano
0.022
-0.005
-16.89%
1 jan 2003 ano
0.017
-0.005
-23.07%
1 jan 2004 ano
0.017
+0.0
0.3%
1 jan 2005 ano
0.016
-0.001
-6.17%
1 jan 2006 ano
0.021
+0.005
27.76%
1 jan 2007 ano
0.023
+0.002
10.33%
1 jan 2008 ano
0.02
-0.003
-13.8%
1 jan 2009 ano
0.025
+0.005
26.17%
1 jan 2010 ano
0.013
-0.012
-46.33%
1 jan 2011 ano
0.016
+0.002
17.99%
1 jan 2012 ano
0.019
+0.003
18.51%
1 jan 2013 ano
0.015
-0.003
-17.5%
1 jan 2014 ano
0.013
-0.002
-14.46%
1 jan 2015 ano
0.01
-0.003
-22.46%
Classificação de países por estatísticas atuais por anos


Comentários: