29
/pt/
pt
AIzaSyAYiBZKx7MnpbEhh9jyipgxe19OcubqV5w
April 1, 2024
117594
Czech Republic
CZE
true
2
1
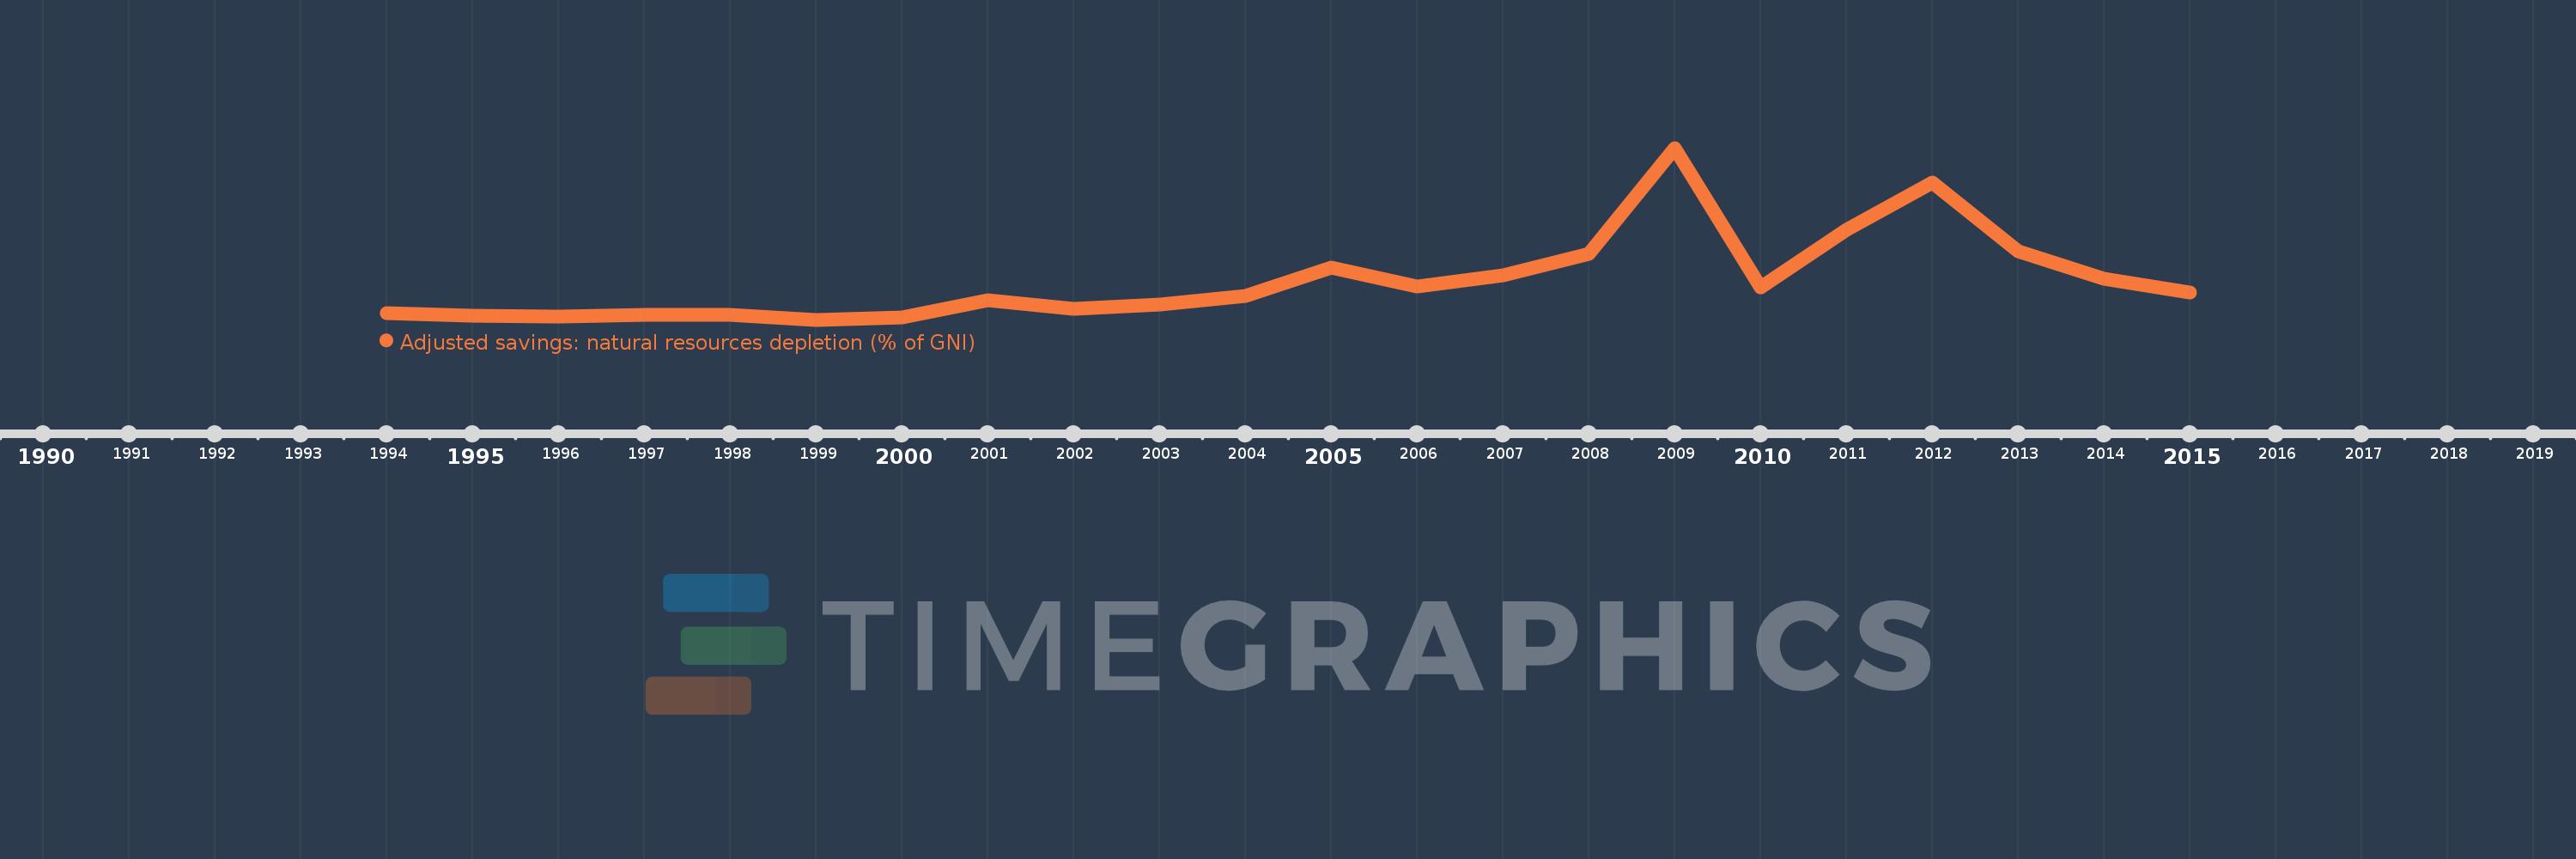
Adjusted savings: natural resources depletion (% of GNI)
2015,2014,2013,2012,2011,2010,2009,2008,2007,2006,2005,2004,2003,2002,2001,2000,1999,1998,1997,1996,1995,1994
Estas estatísticas em outros países:
AfghanistanAlbaniaAlgeriaAngolaArab WorldArgentinaArmeniaAustraliaAustriaAzerbaijanBahamas, TheBahrainBangladeshBarbadosBelarusBelgiumBelizeBeninBhutanBoliviaBotswanaBrazilBrunei DarussalamBulgariaBurkina FasoBurundiCabo VerdeCambodiaCameroonCanadaCaribbean small statesCentral African RepublicCentral Europe and the BalticsChadChileChinaColombiaComorosCongo, Dem. Rep.Congo, Rep.Costa RicaCote d'IvoireCroatiaCubaCyprusCzech RepublicDenmarkDjiboutiDominicaDominican RepublicEarly-demographic dividendEast Asia & PacificEast Asia & Pacific (excluding high income)East Asia & Pacific (IDA & IBRD countries)EcuadorEgypt, Arab Rep.El SalvadorEquatorial GuineaEritreaEstoniaEthiopiaEuro areaEurope & Central AsiaEurope & Central Asia (excluding high income)Europe & Central Asia (IDA & IBRD countries)European UnionFijiFinlandFragile and conflict affected situationsFranceFrench PolynesiaGabonGambia, TheGeorgiaGermanyGhanaGreeceGuatemalaGuineaGuinea-BissauGuyanaHaitiHeavily indebted poor countries (HIPC)High incomeHondurasHong Kong SAR, ChinaHungaryIBRD onlyIcelandIDA & IBRD totalIDA blendIDA onlyIDA totalIndiaIndonesiaIran, Islamic Rep.IraqIrelandIsraelItalyJamaicaJapanJordanKazakhstanKenyaKiribatiKorea, Rep.KuwaitKyrgyz RepublicLao PDRLate-demographic dividendLatin America & Caribbean Latin America & Caribbean (excluding high income)Latin America & the Caribbean (IDA & IBRD countries)LatviaLeast developed countries: UN classificationLebanonLesothoLiberiaLibyaLithuaniaLow & middle incomeLow incomeLower middle incomeLuxembourgMacedonia, FYRMadagascarMalawiMalaysiaMaldivesMaliMauritaniaMauritiusMexicoMicronesia, Fed. Sts.Middle East & North AfricaMiddle East & North Africa (excluding high income)Middle East & North Africa (IDA & IBRD countries)Middle incomeMoldovaMongoliaMoroccoMozambiqueMyanmarNamibiaNepalNetherlandsNew CaledoniaNew ZealandNicaraguaNigerNigeriaNorth AmericaNorwayOECD membersOmanOther small statesPacific island small statesPakistanPanamaPapua New GuineaParaguayPeruPhilippinesPolandPortugalPost-demographic dividendPre-demographic dividendQatarRomaniaRussian FederationRwandaSamoaSao Tome and PrincipeSaudi ArabiaSenegalSeychellesSierra LeoneSingaporeSlovak RepublicSloveniaSmall statesSolomon IslandsSomaliaSouth AfricaSouth AsiaSouth Asia (IDA & IBRD)SpainSri LankaSt. LuciaSt. Vincent and the GrenadinesSub-Saharan Africa Sub-Saharan Africa (excluding high income)Sub-Saharan Africa (IDA & IBRD countries)SudanSurinameSwazilandSwedenSwitzerlandSyrian Arab RepublicTajikistanTanzaniaThailandTogoTongaTrinidad and TobagoTunisiaTurkeyTurkmenistanUgandaUkraineUnited Arab EmiratesUnited KingdomUnited StatesUpper middle incomeUruguayUzbekistanVanuatuVenezuela, RBVietnamWorldYemen, Rep.ZambiaZimbabwe Linha do tempo:
Nesta escala de tempo está apresentado um gráfico de 1994 ano até 2015 ano Czech Republic. Dados de 1993 ano ausente. O número de observações reais por data: 22.
Fonte (nome):
Indicadores de desenvolvimento mundial
Fonte (organização):
World Bank staff estimates based on sources and methods in World Bank's "The Changing Wealth of Nations: Measuring Sustainable Development in the New Millennium" (2011).
Categorias:
Economy & Growth, Energy & Mining
Foi atualizado:
23 abr 2017 ano
Indicadores de alterações dos valores ao longo dos anos
Mínimo:
0.027
1 jan 1999 ano
Máximo:
0.549
1 jan 2009 ano
Na data de observação
Valor
Mudança absoluta
A alteração em relação ao valor anterior
1 jan 1994 ano
0.046
+0.046
0.0%
1 jan 1995 ano
0.04
-0.007
-14.56%
1 jan 1996 ano
0.037
-0.003
-6.4%
1 jan 1997 ano
0.043
+0.005
14.39%
1 jan 1998 ano
0.042
0.0
-0.51%
1 jan 1999 ano
0.027
-0.015
-36.64%
1 jan 2000 ano
0.034
+0.007
25.84%
1 jan 2001 ano
0.086
+0.053
155.74%
1 jan 2002 ano
0.061
-0.025
-29.3%
1 jan 2003 ano
0.072
+0.011
18.72%
1 jan 2004 ano
0.099
+0.027
36.87%
1 jan 2005 ano
0.185
+0.086
86.34%
1 jan 2006 ano
0.129
-0.056
-30.07%
1 jan 2007 ano
0.162
+0.033
25.62%
1 jan 2008 ano
0.228
+0.066
40.46%
1 jan 2009 ano
0.549
+0.321
141.0%
1 jan 2010 ano
0.125
-0.424
-77.32%
1 jan 2011 ano
0.301
+0.177
141.99%
1 jan 2012 ano
0.445
+0.143
47.54%
1 jan 2013 ano
0.235
-0.209
-47.03%
1 jan 2014 ano
0.152
-0.084
-35.55%
1 jan 2015 ano
0.11
-0.042
-27.69%
Classificação de países por estatísticas atuais por anos


Comentários: