29
/pt/
pt
AIzaSyAYiBZKx7MnpbEhh9jyipgxe19OcubqV5w
April 1, 2024
38522
IDA blend
IDB
false
2
1
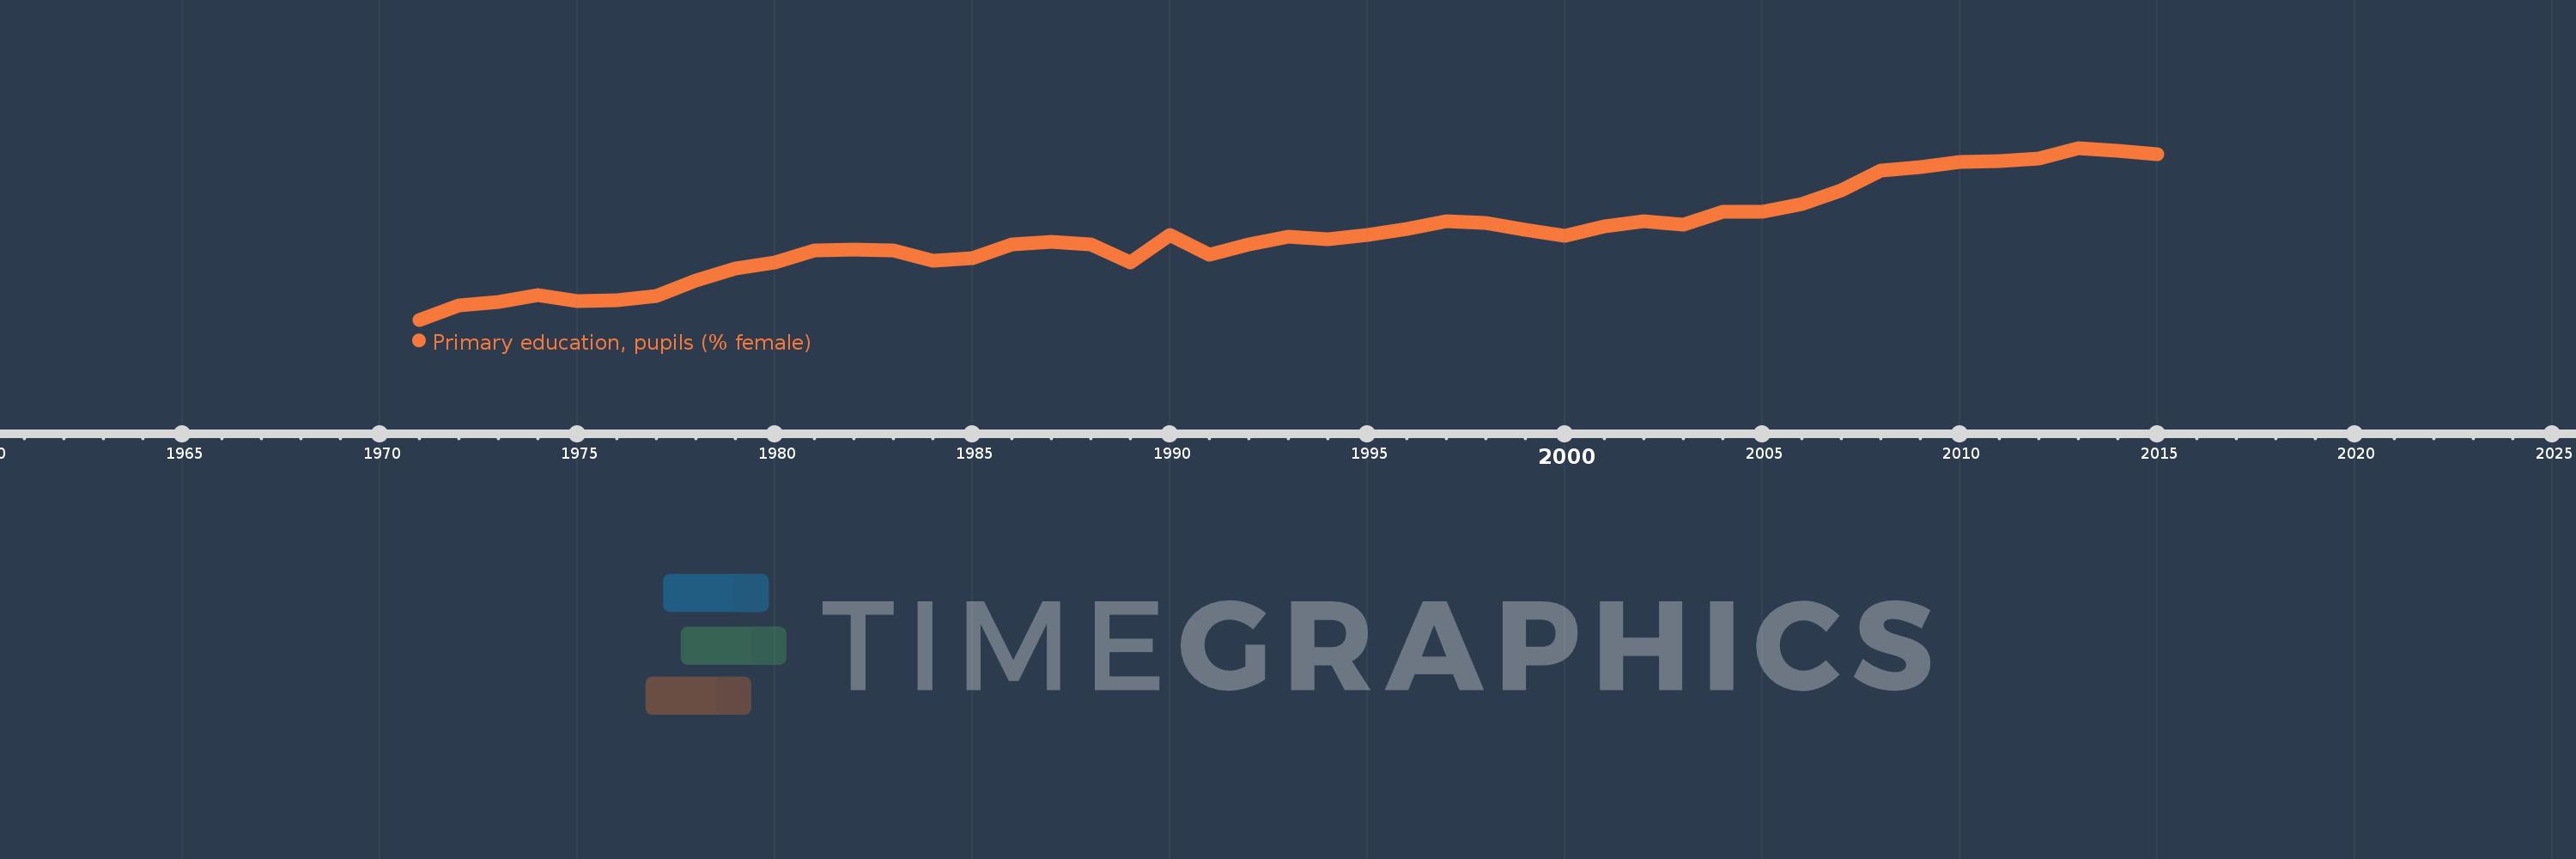
Primary education, pupils (% female)
2015,2014,2013,2012,2011,2010,2009,2008,2007,2006,2005,2004,2003,2002,2001,2000,1999,1998,1997,1996,1995,1994,1993,1992,1991,1990,1989,1988,1987,1986,1985,1984,1983,1982,1981,1980,1979,1978,1977,1976,1975,1974,1973,1972,1971
Estas estatísticas em outros países:
AfghanistanAlbaniaAlgeriaAndorraAngolaAntigua and BarbudaArab WorldArgentinaArmeniaArubaAustraliaAustriaAzerbaijanBahamas, TheBahrainBangladeshBarbadosBelarusBelgiumBelizeBeninBermudaBhutanBoliviaBosnia and HerzegovinaBotswanaBrazilBritish Virgin IslandsBrunei DarussalamBulgariaBurkina FasoBurundiCabo VerdeCambodiaCameroonCanadaCaribbean small statesCayman IslandsCentral African RepublicCentral Europe and the BalticsChadChileChinaColombiaComorosCongo, Dem. Rep.Congo, Rep.Costa RicaCote d'IvoireCroatiaCubaCuracaoCyprusCzech RepublicDenmarkDjiboutiDominicaDominican RepublicEarly-demographic dividendEast Asia & PacificEast Asia & Pacific (excluding high income)East Asia & Pacific (IDA & IBRD countries)EcuadorEgypt, Arab Rep.El SalvadorEquatorial GuineaEritreaEstoniaEthiopiaEuro areaEurope & Central AsiaEurope & Central Asia (excluding high income)Europe & Central Asia (IDA & IBRD countries)European UnionFijiFinlandFragile and conflict affected situationsFranceGabonGambia, TheGeorgiaGermanyGhanaGibraltarGreeceGrenadaGuatemalaGuineaGuinea-BissauGuyanaHaitiHeavily indebted poor countries (HIPC)High incomeHondurasHong Kong SAR, ChinaHungaryIBRD onlyIcelandIDA & IBRD totalIDA blendIDA onlyIDA totalIndiaIndonesiaIran, Islamic Rep.IraqIrelandIsraelItalyJamaicaJapanJordanKazakhstanKenyaKiribatiKorea, Dem. People’s Rep.Korea, Rep.KuwaitKyrgyz RepublicLao PDRLate-demographic dividendLatin America & Caribbean Latin America & Caribbean (excluding high income)Latin America & the Caribbean (IDA & IBRD countries)LatviaLeast developed countries: UN classificationLebanonLesothoLiberiaLibyaLiechtensteinLithuaniaLow & middle incomeLow incomeLower middle incomeLuxembourgMacao SAR, ChinaMacedonia, FYRMadagascarMalawiMalaysiaMaldivesMaliMaltaMarshall IslandsMauritaniaMauritiusMexicoMicronesia, Fed. Sts.Middle East & North AfricaMiddle East & North Africa (excluding high income)Middle East & North Africa (IDA & IBRD countries)Middle incomeMoldovaMonacoMongoliaMontenegroMoroccoMozambiqueMyanmarNamibiaNauruNepalNetherlandsNew ZealandNicaraguaNigerNigeriaNorth AmericaNorwayOECD membersOmanOther small statesPacific island small statesPakistanPalauPanamaPapua New GuineaParaguayPeruPhilippinesPolandPortugalPost-demographic dividendPre-demographic dividendPuerto RicoQatarRomaniaRussian FederationRwandaSamoaSan MarinoSao Tome and PrincipeSaudi ArabiaSenegalSerbiaSeychellesSierra LeoneSingaporeSint Maarten (Dutch part)Slovak RepublicSloveniaSmall statesSolomon IslandsSomaliaSouth AfricaSouth AsiaSouth Asia (IDA & IBRD)South SudanSpainSri LankaSt. Kitts and NevisSt. LuciaSt. Vincent and the GrenadinesSub-Saharan Africa Sub-Saharan Africa (excluding high income)Sub-Saharan Africa (IDA & IBRD countries)SudanSurinameSwazilandSwedenSwitzerlandSyrian Arab RepublicTajikistanTanzaniaThailandTimor-LesteTogoTongaTrinidad and TobagoTunisiaTurkeyTurkmenistanTurks and Caicos IslandsTuvaluUgandaUkraineUnited Arab EmiratesUnited KingdomUnited StatesUpper middle incomeUruguayUzbekistanVanuatuVenezuela, RBVietnamWest Bank and GazaWorldYemen, Rep.ZambiaZimbabwe Linha do tempo:
Nesta escala de tempo está apresentado um gráfico de 1971 ano até 2015 ano IDA blend. Dados de 1970 ano ausente. O número de observações reais por data: 45.
Fonte (nome):
Indicadores de desenvolvimento mundial
Fonte (organização):
United Nations Educational, Scientific, and Cultural Organization (UNESCO) Institute for Statistics.
Categorias:
Education, Gender
Foi atualizado:
23 abr 2017 ano
Indicadores de alterações dos valores ao longo dos anos
Mínimo:
41.716
1 jan 1971 ano
Máximo:
46.571
1 jan 2013 ano
Na data de observação
Valor
Mudança absoluta
A alteração em relação ao valor anterior
1 jan 1971 ano
41.716
+41.716
0.0%
1 jan 1972 ano
42.13
+0.414
0.99%
1 jan 1973 ano
42.212
+0.082
0.19%
1 jan 1974 ano
42.417
+0.205
0.49%
1 jan 1975 ano
42.25
-0.167
-0.39%
1 jan 1976 ano
42.261
+0.011
0.03%
1 jan 1977 ano
42.398
+0.137
0.32%
1 jan 1978 ano
42.821
+0.422
1.0%
1 jan 1979 ano
43.158
+0.338
0.79%
1 jan 1980 ano
43.341
+0.183
0.42%
1 jan 1981 ano
43.663
+0.322
0.74%
1 jan 1982 ano
43.711
+0.049
0.11%
1 jan 1983 ano
43.679
-0.032
-0.07%
1 jan 1984 ano
43.393
-0.286
-0.66%
1 jan 1985 ano
43.462
+0.07
0.16%
1 jan 1986 ano
43.838
+0.376
0.86%
1 jan 1987 ano
43.914
+0.076
0.17%
1 jan 1988 ano
43.845
-0.069
-0.16%
1 jan 1989 ano
43.336
-0.508
-1.16%
1 jan 1990 ano
44.104
+0.767
1.77%
1 jan 1991 ano
43.552
-0.551
-1.25%
1 jan 1992 ano
43.843
+0.29
0.67%
1 jan 1993 ano
44.064
+0.221
0.5%
1 jan 1994 ano
44.001
-0.063
-0.14%
1 jan 1995 ano
44.124
+0.123
0.28%
1 jan 1996 ano
44.288
+0.164
0.37%
1 jan 1997 ano
44.508
+0.22
0.5%
1 jan 1998 ano
44.444
-0.064
-0.14%
1 jan 1999 ano
44.264
-0.18
-0.41%
1 jan 2000 ano
44.092
-0.172
-0.39%
1 jan 2001 ano
44.344
+0.252
0.57%
1 jan 2002 ano
44.507
+0.163
0.37%
1 jan 2003 ano
44.395
-0.111
-0.25%
1 jan 2004 ano
44.763
+0.368
0.83%
1 jan 2005 ano
44.772
+0.009
0.02%
1 jan 2006 ano
44.978
+0.207
0.46%
1 jan 2007 ano
45.384
+0.406
0.9%
1 jan 2008 ano
45.921
+0.537
1.18%
1 jan 2009 ano
46.034
+0.113
0.25%
1 jan 2010 ano
46.187
+0.153
0.33%
1 jan 2011 ano
46.192
+0.006
0.01%
1 jan 2012 ano
46.274
+0.082
0.18%
1 jan 2013 ano
46.571
+0.297
0.64%
1 jan 2014 ano
46.484
-0.087
-0.19%
1 jan 2015 ano
46.386
-0.099
-0.21%
Classificação de países por estatísticas atuais por anos


Comentários: