29
/pt/
pt
AIzaSyAYiBZKx7MnpbEhh9jyipgxe19OcubqV5w
April 1, 2024
281589
Venezuela, RB
VEN
true
2
1
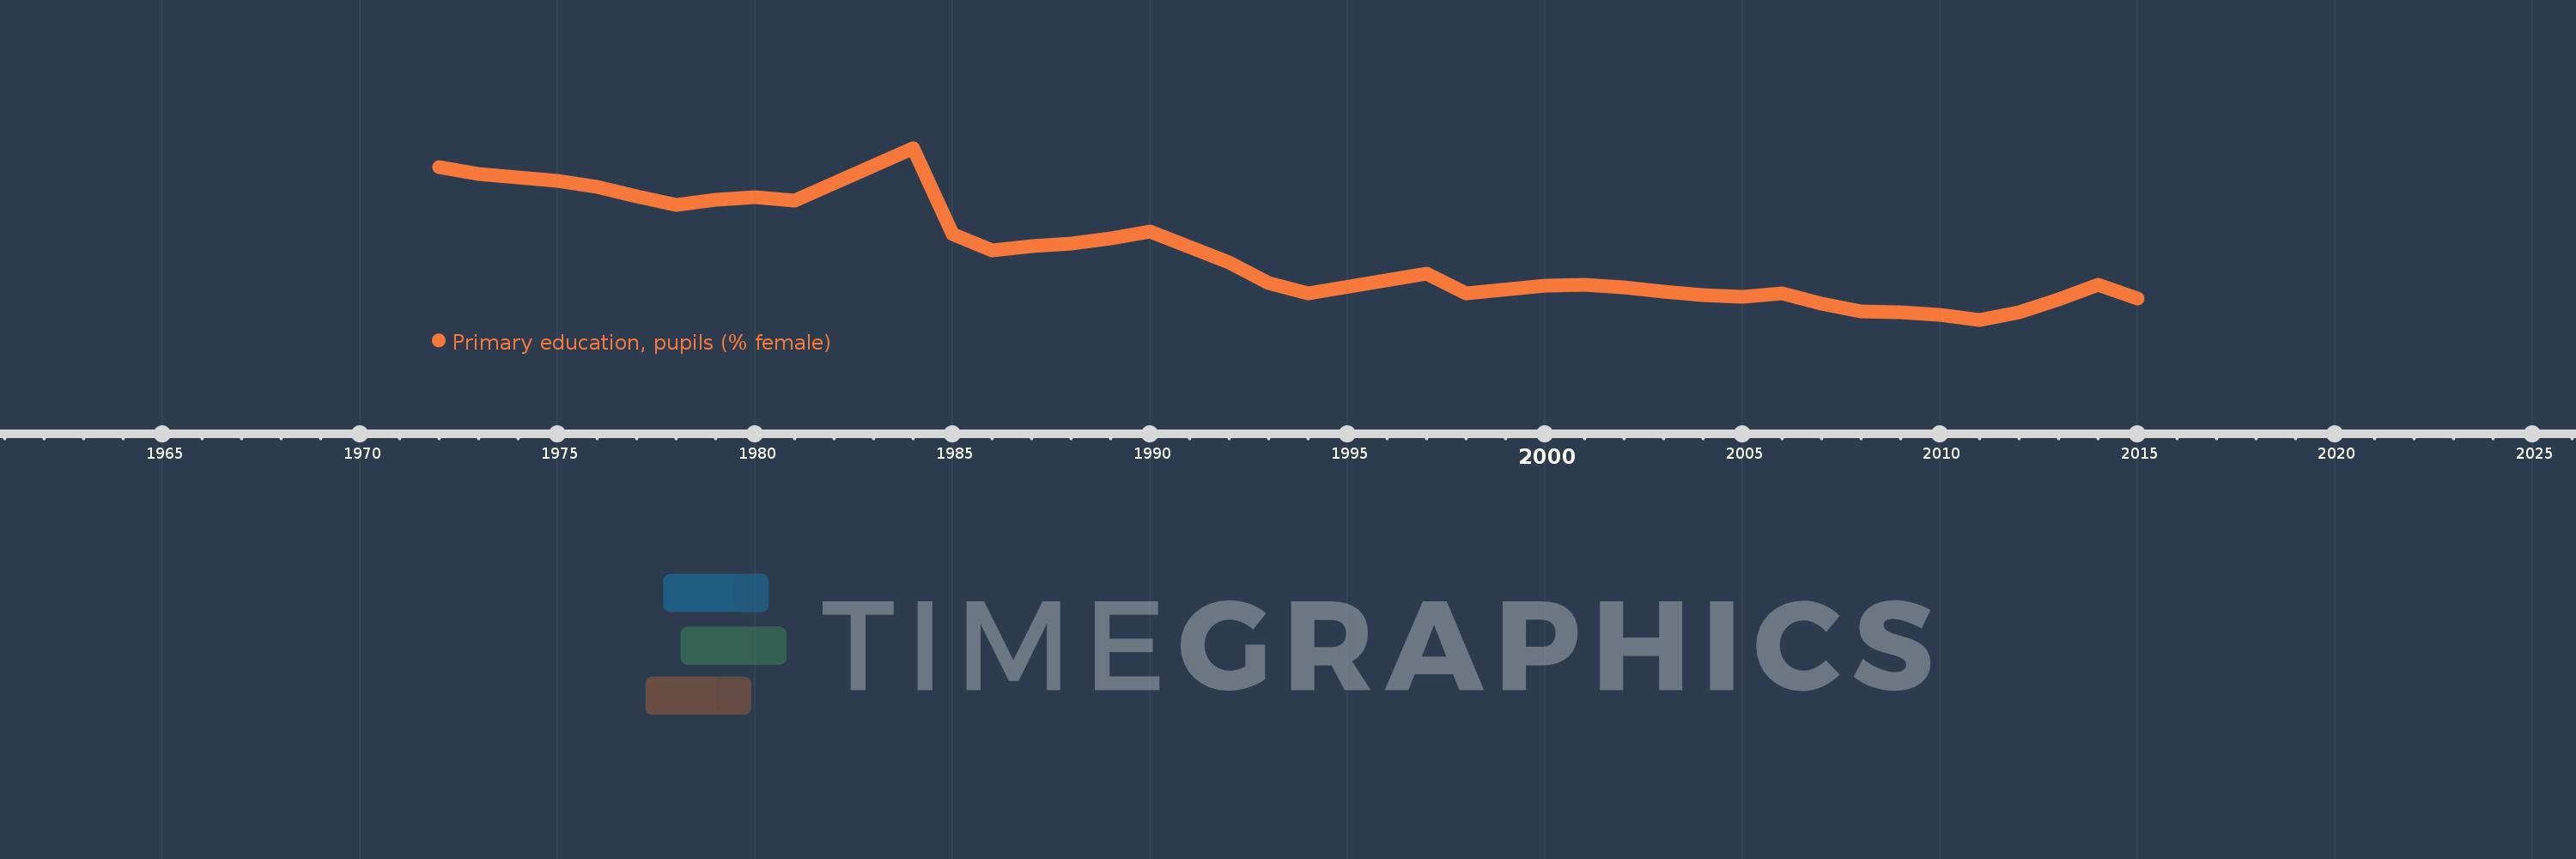
Primary education, pupils (% female)
2015,2014,2013,2012,2011,2010,2009,2008,2007,2006,2005,2004,2003,2002,2001,2000,1998,1997,1994,1993,1992,1990,1989,1988,1987,1986,1985,1984,1981,1980,1979,1978,1977,1976,1975,1974,1973,1972
Estas estatísticas em outros países:
AfghanistanAlbaniaAlgeriaAndorraAngolaAntigua and BarbudaArab WorldArgentinaArmeniaArubaAustraliaAustriaAzerbaijanBahamas, TheBahrainBangladeshBarbadosBelarusBelgiumBelizeBeninBermudaBhutanBoliviaBosnia and HerzegovinaBotswanaBrazilBritish Virgin IslandsBrunei DarussalamBulgariaBurkina FasoBurundiCabo VerdeCambodiaCameroonCanadaCaribbean small statesCayman IslandsCentral African RepublicCentral Europe and the BalticsChadChileChinaColombiaComorosCongo, Dem. Rep.Congo, Rep.Costa RicaCote d'IvoireCroatiaCubaCuracaoCyprusCzech RepublicDenmarkDjiboutiDominicaDominican RepublicEarly-demographic dividendEast Asia & PacificEast Asia & Pacific (excluding high income)East Asia & Pacific (IDA & IBRD countries)EcuadorEgypt, Arab Rep.El SalvadorEquatorial GuineaEritreaEstoniaEthiopiaEuro areaEurope & Central AsiaEurope & Central Asia (excluding high income)Europe & Central Asia (IDA & IBRD countries)European UnionFijiFinlandFragile and conflict affected situationsFranceGabonGambia, TheGeorgiaGermanyGhanaGibraltarGreeceGrenadaGuatemalaGuineaGuinea-BissauGuyanaHaitiHeavily indebted poor countries (HIPC)High incomeHondurasHong Kong SAR, ChinaHungaryIBRD onlyIcelandIDA & IBRD totalIDA blendIDA onlyIDA totalIndiaIndonesiaIran, Islamic Rep.IraqIrelandIsraelItalyJamaicaJapanJordanKazakhstanKenyaKiribatiKorea, Dem. People’s Rep.Korea, Rep.KuwaitKyrgyz RepublicLao PDRLate-demographic dividendLatin America & Caribbean Latin America & Caribbean (excluding high income)Latin America & the Caribbean (IDA & IBRD countries)LatviaLeast developed countries: UN classificationLebanonLesothoLiberiaLibyaLiechtensteinLithuaniaLow & middle incomeLow incomeLower middle incomeLuxembourgMacao SAR, ChinaMacedonia, FYRMadagascarMalawiMalaysiaMaldivesMaliMaltaMarshall IslandsMauritaniaMauritiusMexicoMicronesia, Fed. Sts.Middle East & North AfricaMiddle East & North Africa (excluding high income)Middle East & North Africa (IDA & IBRD countries)Middle incomeMoldovaMonacoMongoliaMontenegroMoroccoMozambiqueMyanmarNamibiaNauruNepalNetherlandsNew ZealandNicaraguaNigerNigeriaNorth AmericaNorwayOECD membersOmanOther small statesPacific island small statesPakistanPalauPanamaPapua New GuineaParaguayPeruPhilippinesPolandPortugalPost-demographic dividendPre-demographic dividendPuerto RicoQatarRomaniaRussian FederationRwandaSamoaSan MarinoSao Tome and PrincipeSaudi ArabiaSenegalSerbiaSeychellesSierra LeoneSingaporeSint Maarten (Dutch part)Slovak RepublicSloveniaSmall statesSolomon IslandsSomaliaSouth AfricaSouth AsiaSouth Asia (IDA & IBRD)South SudanSpainSri LankaSt. Kitts and NevisSt. LuciaSt. Vincent and the GrenadinesSub-Saharan Africa Sub-Saharan Africa (excluding high income)Sub-Saharan Africa (IDA & IBRD countries)SudanSurinameSwazilandSwedenSwitzerlandSyrian Arab RepublicTajikistanTanzaniaThailandTimor-LesteTogoTongaTrinidad and TobagoTunisiaTurkeyTurkmenistanTurks and Caicos IslandsTuvaluUgandaUkraineUnited Arab EmiratesUnited KingdomUnited StatesUpper middle incomeUruguayUzbekistanVanuatuVenezuela, RBVietnamWest Bank and GazaWorldYemen, Rep.ZambiaZimbabwe Linha do tempo:
Nesta escala de tempo está apresentado um gráfico de 1972 ano até 2015 ano Venezuela, RB. Dados de 1971 ano ausente. O número de observações reais por data: 38.
Fonte (nome):
Indicadores de desenvolvimento mundial
Fonte (organização):
United Nations Educational, Scientific, and Cultural Organization (UNESCO) Institute for Statistics.
Categorias:
Education, Gender
Foi atualizado:
23 abr 2017 ano
Indicadores de alterações dos valores ao longo dos anos
Mínimo:
48.196
1 jan 2011 ano
Máximo:
49.844
1 jan 1984 ano
Na data de observação
Valor
Mudança absoluta
A alteração em relação ao valor anterior
1 jan 1972 ano
49.662
+49.662
0.0%
1 jan 1973 ano
49.597
-0.065
-0.13%
1 jan 1974 ano
49.563
-0.035
-0.07%
1 jan 1975 ano
49.532
-0.03
-0.06%
1 jan 1976 ano
49.471
-0.062
-0.12%
1 jan 1977 ano
49.383
-0.088
-0.18%
1 jan 1978 ano
49.301
-0.082
-0.17%
1 jan 1979 ano
49.346
+0.045
0.09%
1 jan 1980 ano
49.374
+0.028
0.06%
1 jan 1981 ano
49.341
-0.033
-0.07%
1 jan 1984 ano
49.844
+0.503
1.02%
1 jan 1985 ano
49.019
-0.825
-1.66%
1 jan 1986 ano
48.86
-0.159
-0.32%
1 jan 1987 ano
48.9
+0.04
0.08%
1 jan 1988 ano
48.924
+0.024
0.05%
1 jan 1989 ano
48.98
+0.056
0.11%
1 jan 1990 ano
49.045
+0.065
0.13%
1 jan 1992 ano
48.749
-0.296
-0.6%
1 jan 1993 ano
48.546
-0.203
-0.42%
1 jan 1994 ano
48.451
-0.096
-0.2%
1 jan 1997 ano
48.639
+0.189
0.39%
1 jan 1998 ano
48.453
-0.187
-0.38%
1 jan 2000 ano
48.524
+0.072
0.15%
1 jan 2001 ano
48.528
+0.004
0.01%
1 jan 2002 ano
48.507
-0.021
-0.04%
1 jan 2003 ano
48.466
-0.041
-0.08%
1 jan 2004 ano
48.436
-0.031
-0.06%
1 jan 2005 ano
48.413
-0.023
-0.05%
1 jan 2006 ano
48.446
+0.033
0.07%
1 jan 2007 ano
48.354
-0.092
-0.19%
1 jan 2008 ano
48.275
-0.08
-0.16%
1 jan 2009 ano
48.264
-0.01
-0.02%
1 jan 2010 ano
48.244
-0.02
-0.04%
1 jan 2011 ano
48.196
-0.048
-0.1%
1 jan 2012 ano
48.268
+0.071
0.15%
1 jan 2013 ano
48.394
+0.127
0.26%
1 jan 2014 ano
48.532
+0.138
0.29%
1 jan 2015 ano
48.402
-0.131
-0.27%
Classificação de países por estatísticas atuais por anos


Comentários: