29
/pt/
pt
AIzaSyAYiBZKx7MnpbEhh9jyipgxe19OcubqV5w
April 1, 2024
132566
Fiji
FJI
true
2
1
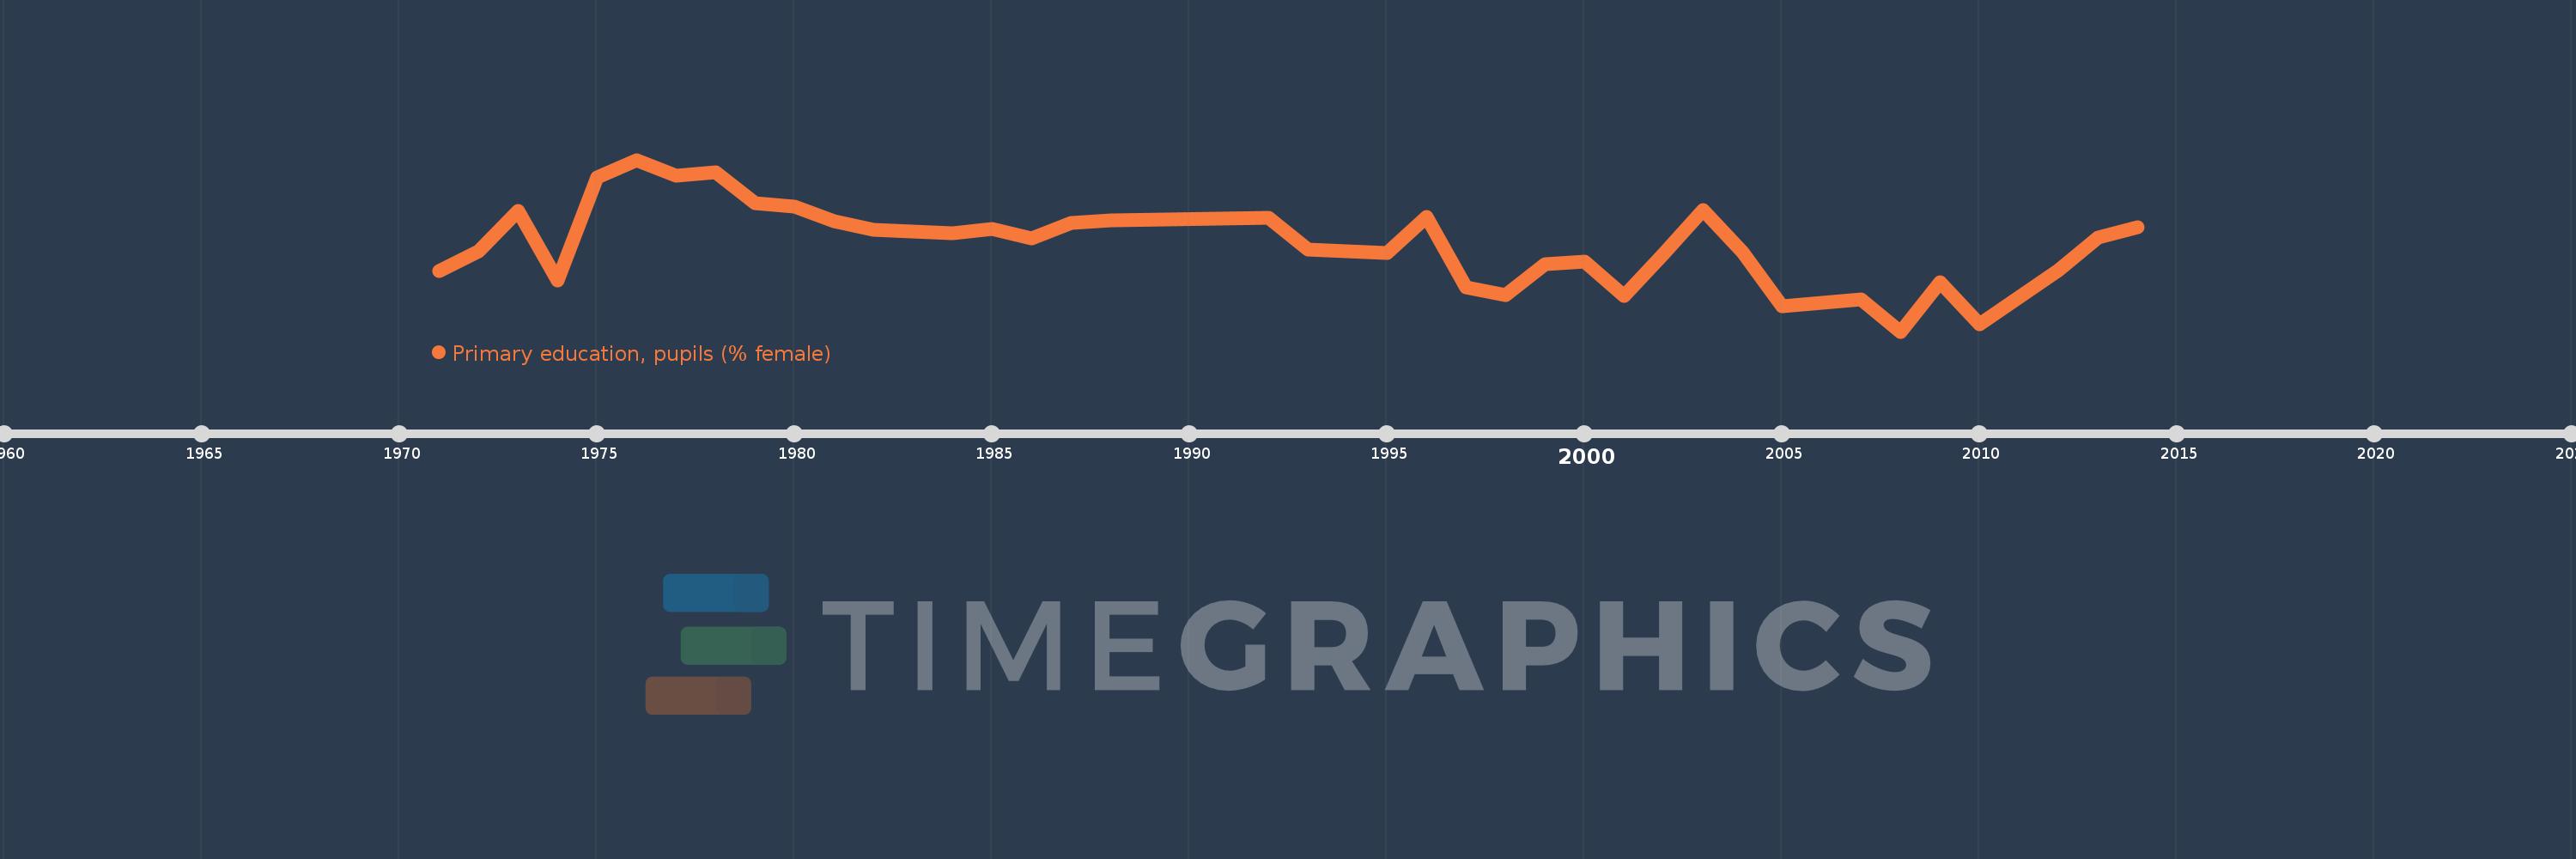
Primary education, pupils (% female)
2014,2013,2012,2010,2009,2008,2007,2005,2004,2003,2002,2001,2000,1999,1998,1997,1996,1995,1993,1992,1988,1987,1986,1985,1984,1982,1981,1980,1979,1978,1977,1976,1975,1974,1973,1972,1971
Estas estatísticas em outros países:
AfghanistanAlbaniaAlgeriaAndorraAngolaAntigua and BarbudaArab WorldArgentinaArmeniaArubaAustraliaAustriaAzerbaijanBahamas, TheBahrainBangladeshBarbadosBelarusBelgiumBelizeBeninBermudaBhutanBoliviaBosnia and HerzegovinaBotswanaBrazilBritish Virgin IslandsBrunei DarussalamBulgariaBurkina FasoBurundiCabo VerdeCambodiaCameroonCanadaCaribbean small statesCayman IslandsCentral African RepublicCentral Europe and the BalticsChadChileChinaColombiaComorosCongo, Dem. Rep.Congo, Rep.Costa RicaCote d'IvoireCroatiaCubaCuracaoCyprusCzech RepublicDenmarkDjiboutiDominicaDominican RepublicEarly-demographic dividendEast Asia & PacificEast Asia & Pacific (excluding high income)East Asia & Pacific (IDA & IBRD countries)EcuadorEgypt, Arab Rep.El SalvadorEquatorial GuineaEritreaEstoniaEthiopiaEuro areaEurope & Central AsiaEurope & Central Asia (excluding high income)Europe & Central Asia (IDA & IBRD countries)European UnionFijiFinlandFragile and conflict affected situationsFranceGabonGambia, TheGeorgiaGermanyGhanaGibraltarGreeceGrenadaGuatemalaGuineaGuinea-BissauGuyanaHaitiHeavily indebted poor countries (HIPC)High incomeHondurasHong Kong SAR, ChinaHungaryIBRD onlyIcelandIDA & IBRD totalIDA blendIDA onlyIDA totalIndiaIndonesiaIran, Islamic Rep.IraqIrelandIsraelItalyJamaicaJapanJordanKazakhstanKenyaKiribatiKorea, Dem. People’s Rep.Korea, Rep.KuwaitKyrgyz RepublicLao PDRLate-demographic dividendLatin America & Caribbean Latin America & Caribbean (excluding high income)Latin America & the Caribbean (IDA & IBRD countries)LatviaLeast developed countries: UN classificationLebanonLesothoLiberiaLibyaLiechtensteinLithuaniaLow & middle incomeLow incomeLower middle incomeLuxembourgMacao SAR, ChinaMacedonia, FYRMadagascarMalawiMalaysiaMaldivesMaliMaltaMarshall IslandsMauritaniaMauritiusMexicoMicronesia, Fed. Sts.Middle East & North AfricaMiddle East & North Africa (excluding high income)Middle East & North Africa (IDA & IBRD countries)Middle incomeMoldovaMonacoMongoliaMontenegroMoroccoMozambiqueMyanmarNamibiaNauruNepalNetherlandsNew ZealandNicaraguaNigerNigeriaNorth AmericaNorwayOECD membersOmanOther small statesPacific island small statesPakistanPalauPanamaPapua New GuineaParaguayPeruPhilippinesPolandPortugalPost-demographic dividendPre-demographic dividendPuerto RicoQatarRomaniaRussian FederationRwandaSamoaSan MarinoSao Tome and PrincipeSaudi ArabiaSenegalSerbiaSeychellesSierra LeoneSingaporeSint Maarten (Dutch part)Slovak RepublicSloveniaSmall statesSolomon IslandsSomaliaSouth AfricaSouth AsiaSouth Asia (IDA & IBRD)South SudanSpainSri LankaSt. Kitts and NevisSt. LuciaSt. Vincent and the GrenadinesSub-Saharan Africa Sub-Saharan Africa (excluding high income)Sub-Saharan Africa (IDA & IBRD countries)SudanSurinameSwazilandSwedenSwitzerlandSyrian Arab RepublicTajikistanTanzaniaThailandTimor-LesteTogoTongaTrinidad and TobagoTunisiaTurkeyTurkmenistanTurks and Caicos IslandsTuvaluUgandaUkraineUnited Arab EmiratesUnited KingdomUnited StatesUpper middle incomeUruguayUzbekistanVanuatuVenezuela, RBVietnamWest Bank and GazaWorldYemen, Rep.ZambiaZimbabwe Linha do tempo:
Nesta escala de tempo está apresentado um gráfico de 1971 ano até 2014 ano Fiji. Dados de 1970 ano ausente. O número de observações reais por data: 37.
Fonte (nome):
Indicadores de desenvolvimento mundial
Fonte (organização):
United Nations Educational, Scientific, and Cultural Organization (UNESCO) Institute for Statistics.
Categorias:
Education, Gender
Foi atualizado:
23 abr 2017 ano
Indicadores de alterações dos valores ao longo dos anos
Mínimo:
47.812
1 jan 2008 ano
Máximo:
48.936
1 jan 1976 ano
Na data de observação
Valor
Mudança absoluta
A alteração em relação ao valor anterior
1 jan 1971 ano
48.206
+48.206
0.0%
1 jan 1972 ano
48.34
+0.135
0.28%
1 jan 1973 ano
48.603
+0.263
0.54%
1 jan 1974 ano
48.147
-0.456
-0.94%
1 jan 1975 ano
48.819
+0.672
1.4%
1 jan 1976 ano
48.936
+0.117
0.24%
1 jan 1977 ano
48.831
-0.105
-0.21%
1 jan 1978 ano
48.856
+0.025
0.05%
1 jan 1979 ano
48.651
-0.205
-0.42%
1 jan 1980 ano
48.63
-0.021
-0.04%
1 jan 1981 ano
48.536
-0.095
-0.19%
1 jan 1982 ano
48.479
-0.057
-0.12%
1 jan 1984 ano
48.457
-0.022
-0.05%
1 jan 1985 ano
48.483
+0.025
0.05%
1 jan 1986 ano
48.421
-0.062
-0.13%
1 jan 1987 ano
48.523
+0.102
0.21%
1 jan 1988 ano
48.538
+0.015
0.03%
1 jan 1992 ano
48.557
+0.02
0.04%
1 jan 1993 ano
48.346
-0.212
-0.44%
1 jan 1995 ano
48.324
-0.022
-0.04%
1 jan 1996 ano
48.564
+0.24
0.5%
1 jan 1997 ano
48.101
-0.463
-0.95%
1 jan 1998 ano
48.051
-0.05
-0.1%
1 jan 1999 ano
48.255
+0.205
0.43%
1 jan 2000 ano
48.27
+0.015
0.03%
1 jan 2001 ano
48.047
-0.223
-0.46%
1 jan 2002 ano
48.32
+0.273
0.57%
1 jan 2003 ano
48.606
+0.286
0.59%
1 jan 2004 ano
48.334
-0.273
-0.56%
1 jan 2005 ano
47.976
-0.358
-0.74%
1 jan 2007 ano
48.025
+0.049
0.1%
1 jan 2008 ano
47.812
-0.212
-0.44%
1 jan 2009 ano
48.135
+0.323
0.68%
1 jan 2010 ano
47.861
-0.274
-0.57%
1 jan 2012 ano
48.216
+0.355
0.74%
1 jan 2013 ano
48.43
+0.214
0.44%
1 jan 2014 ano
48.495
+0.066
0.14%
Classificação de países por estatísticas atuais por anos


Comentários: