29
/pt/
pt
AIzaSyAYiBZKx7MnpbEhh9jyipgxe19OcubqV5w
April 1, 2024
157866
Iran, Islamic Rep.
IRN
true
2
1
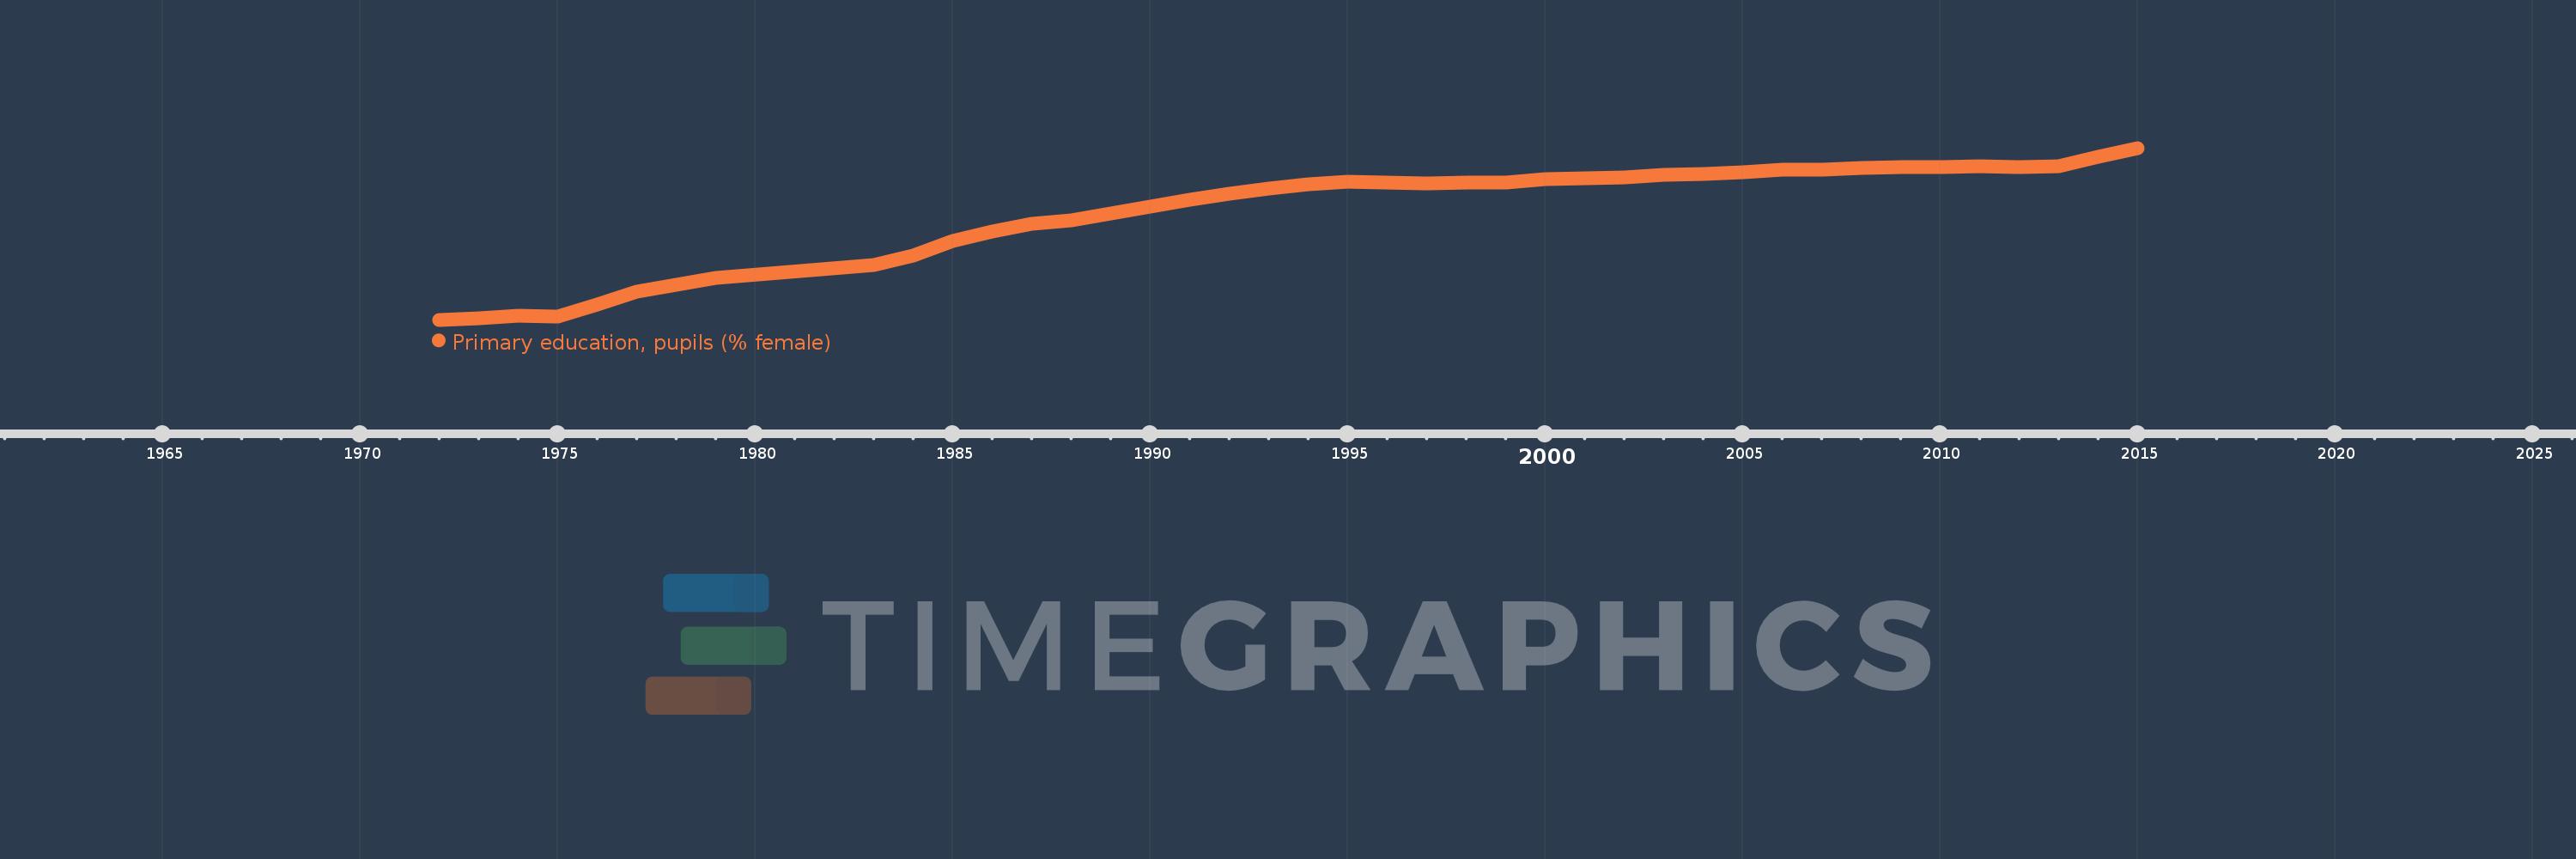
Primary education, pupils (% female)
2015,2014,2013,2012,2011,2010,2009,2008,2007,2006,2005,2004,2003,2002,2001,2000,1999,1998,1997,1996,1995,1994,1993,1992,1991,1990,1989,1988,1987,1986,1985,1984,1983,1979,1978,1977,1976,1975,1974,1973,1972
Estas estatísticas em outros países:
AfghanistanAlbaniaAlgeriaAndorraAngolaAntigua and BarbudaArab WorldArgentinaArmeniaArubaAustraliaAustriaAzerbaijanBahamas, TheBahrainBangladeshBarbadosBelarusBelgiumBelizeBeninBermudaBhutanBoliviaBosnia and HerzegovinaBotswanaBrazilBritish Virgin IslandsBrunei DarussalamBulgariaBurkina FasoBurundiCabo VerdeCambodiaCameroonCanadaCaribbean small statesCayman IslandsCentral African RepublicCentral Europe and the BalticsChadChileChinaColombiaComorosCongo, Dem. Rep.Congo, Rep.Costa RicaCote d'IvoireCroatiaCubaCuracaoCyprusCzech RepublicDenmarkDjiboutiDominicaDominican RepublicEarly-demographic dividendEast Asia & PacificEast Asia & Pacific (excluding high income)East Asia & Pacific (IDA & IBRD countries)EcuadorEgypt, Arab Rep.El SalvadorEquatorial GuineaEritreaEstoniaEthiopiaEuro areaEurope & Central AsiaEurope & Central Asia (excluding high income)Europe & Central Asia (IDA & IBRD countries)European UnionFijiFinlandFragile and conflict affected situationsFranceGabonGambia, TheGeorgiaGermanyGhanaGibraltarGreeceGrenadaGuatemalaGuineaGuinea-BissauGuyanaHaitiHeavily indebted poor countries (HIPC)High incomeHondurasHong Kong SAR, ChinaHungaryIBRD onlyIcelandIDA & IBRD totalIDA blendIDA onlyIDA totalIndiaIndonesiaIran, Islamic Rep.IraqIrelandIsraelItalyJamaicaJapanJordanKazakhstanKenyaKiribatiKorea, Dem. People’s Rep.Korea, Rep.KuwaitKyrgyz RepublicLao PDRLate-demographic dividendLatin America & Caribbean Latin America & Caribbean (excluding high income)Latin America & the Caribbean (IDA & IBRD countries)LatviaLeast developed countries: UN classificationLebanonLesothoLiberiaLibyaLiechtensteinLithuaniaLow & middle incomeLow incomeLower middle incomeLuxembourgMacao SAR, ChinaMacedonia, FYRMadagascarMalawiMalaysiaMaldivesMaliMaltaMarshall IslandsMauritaniaMauritiusMexicoMicronesia, Fed. Sts.Middle East & North AfricaMiddle East & North Africa (excluding high income)Middle East & North Africa (IDA & IBRD countries)Middle incomeMoldovaMonacoMongoliaMontenegroMoroccoMozambiqueMyanmarNamibiaNauruNepalNetherlandsNew ZealandNicaraguaNigerNigeriaNorth AmericaNorwayOECD membersOmanOther small statesPacific island small statesPakistanPalauPanamaPapua New GuineaParaguayPeruPhilippinesPolandPortugalPost-demographic dividendPre-demographic dividendPuerto RicoQatarRomaniaRussian FederationRwandaSamoaSan MarinoSao Tome and PrincipeSaudi ArabiaSenegalSerbiaSeychellesSierra LeoneSingaporeSint Maarten (Dutch part)Slovak RepublicSloveniaSmall statesSolomon IslandsSomaliaSouth AfricaSouth AsiaSouth Asia (IDA & IBRD)South SudanSpainSri LankaSt. Kitts and NevisSt. LuciaSt. Vincent and the GrenadinesSub-Saharan Africa Sub-Saharan Africa (excluding high income)Sub-Saharan Africa (IDA & IBRD countries)SudanSurinameSwazilandSwedenSwitzerlandSyrian Arab RepublicTajikistanTanzaniaThailandTimor-LesteTogoTongaTrinidad and TobagoTunisiaTurkeyTurkmenistanTurks and Caicos IslandsTuvaluUgandaUkraineUnited Arab EmiratesUnited KingdomUnited StatesUpper middle incomeUruguayUzbekistanVanuatuVenezuela, RBVietnamWest Bank and GazaWorldYemen, Rep.ZambiaZimbabwe Linha do tempo:
Nesta escala de tempo está apresentado um gráfico de 1972 ano até 2015 ano Iran, Islamic Rep.. Dados de 1971 ano ausente. O número de observações reais por data: 41.
Fonte (nome):
Indicadores de desenvolvimento mundial
Fonte (organização):
United Nations Educational, Scientific, and Cultural Organization (UNESCO) Institute for Statistics.
Categorias:
Education, Gender
Foi atualizado:
23 abr 2017 ano
Indicadores de alterações dos valores ao longo dos anos
Mínimo:
35.329
1 jan 1972 ano
Máximo:
50.096
1 jan 2015 ano
Na data de observação
Valor
Mudança absoluta
A alteração em relação ao valor anterior
1 jan 1972 ano
35.329
+35.329
0.0%
1 jan 1973 ano
35.468
+0.139
0.39%
1 jan 1974 ano
35.653
+0.185
0.52%
1 jan 1975 ano
35.6
-0.053
-0.15%
1 jan 1976 ano
36.619
+1.019
2.86%
1 jan 1977 ano
37.718
+1.099
3.0%
1 jan 1978 ano
38.351
+0.632
1.68%
1 jan 1979 ano
38.889
+0.538
1.4%
1 jan 1983 ano
40.0
+1.112
2.86%
1 jan 1984 ano
40.849
+0.849
2.12%
1 jan 1985 ano
42.131
+1.282
3.14%
1 jan 1986 ano
42.934
+0.803
1.91%
1 jan 1987 ano
43.607
+0.674
1.57%
1 jan 1988 ano
43.883
+0.275
0.63%
1 jan 1989 ano
44.477
+0.594
1.35%
1 jan 1990 ano
45.081
+0.605
1.36%
1 jan 1991 ano
45.671
+0.59
1.31%
1 jan 1992 ano
46.195
+0.524
1.15%
1 jan 1993 ano
46.623
+0.428
0.93%
1 jan 1994 ano
46.962
+0.34
0.73%
1 jan 1995 ano
47.171
+0.209
0.44%
1 jan 1996 ano
47.14
-0.031
-0.07%
1 jan 1997 ano
47.024
-0.116
-0.25%
1 jan 1998 ano
47.116
+0.091
0.19%
1 jan 1999 ano
47.126
+0.01
0.02%
1 jan 2000 ano
47.379
+0.253
0.54%
1 jan 2001 ano
47.526
+0.147
0.31%
1 jan 2002 ano
47.595
+0.069
0.14%
1 jan 2003 ano
47.757
+0.162
0.34%
1 jan 2004 ano
47.894
+0.136
0.29%
1 jan 2005 ano
47.99
+0.097
0.2%
1 jan 2006 ano
48.193
+0.203
0.42%
1 jan 2007 ano
48.242
+0.049
0.1%
1 jan 2008 ano
48.359
+0.117
0.24%
1 jan 2009 ano
48.441
+0.082
0.17%
1 jan 2010 ano
48.431
-0.01
-0.02%
1 jan 2011 ano
48.492
+0.062
0.13%
1 jan 2012 ano
48.461
-0.031
-0.06%
1 jan 2013 ano
48.491
+0.03
0.06%
1 jan 2014 ano
49.315
+0.824
1.7%
1 jan 2015 ano
50.096
+0.781
1.58%
Classificação de países por estatísticas atuais por anos


Comentários: