29
/pt/
pt
AIzaSyAYiBZKx7MnpbEhh9jyipgxe19OcubqV5w
April 1, 2024
247971
Spain
ESP
true
2
1
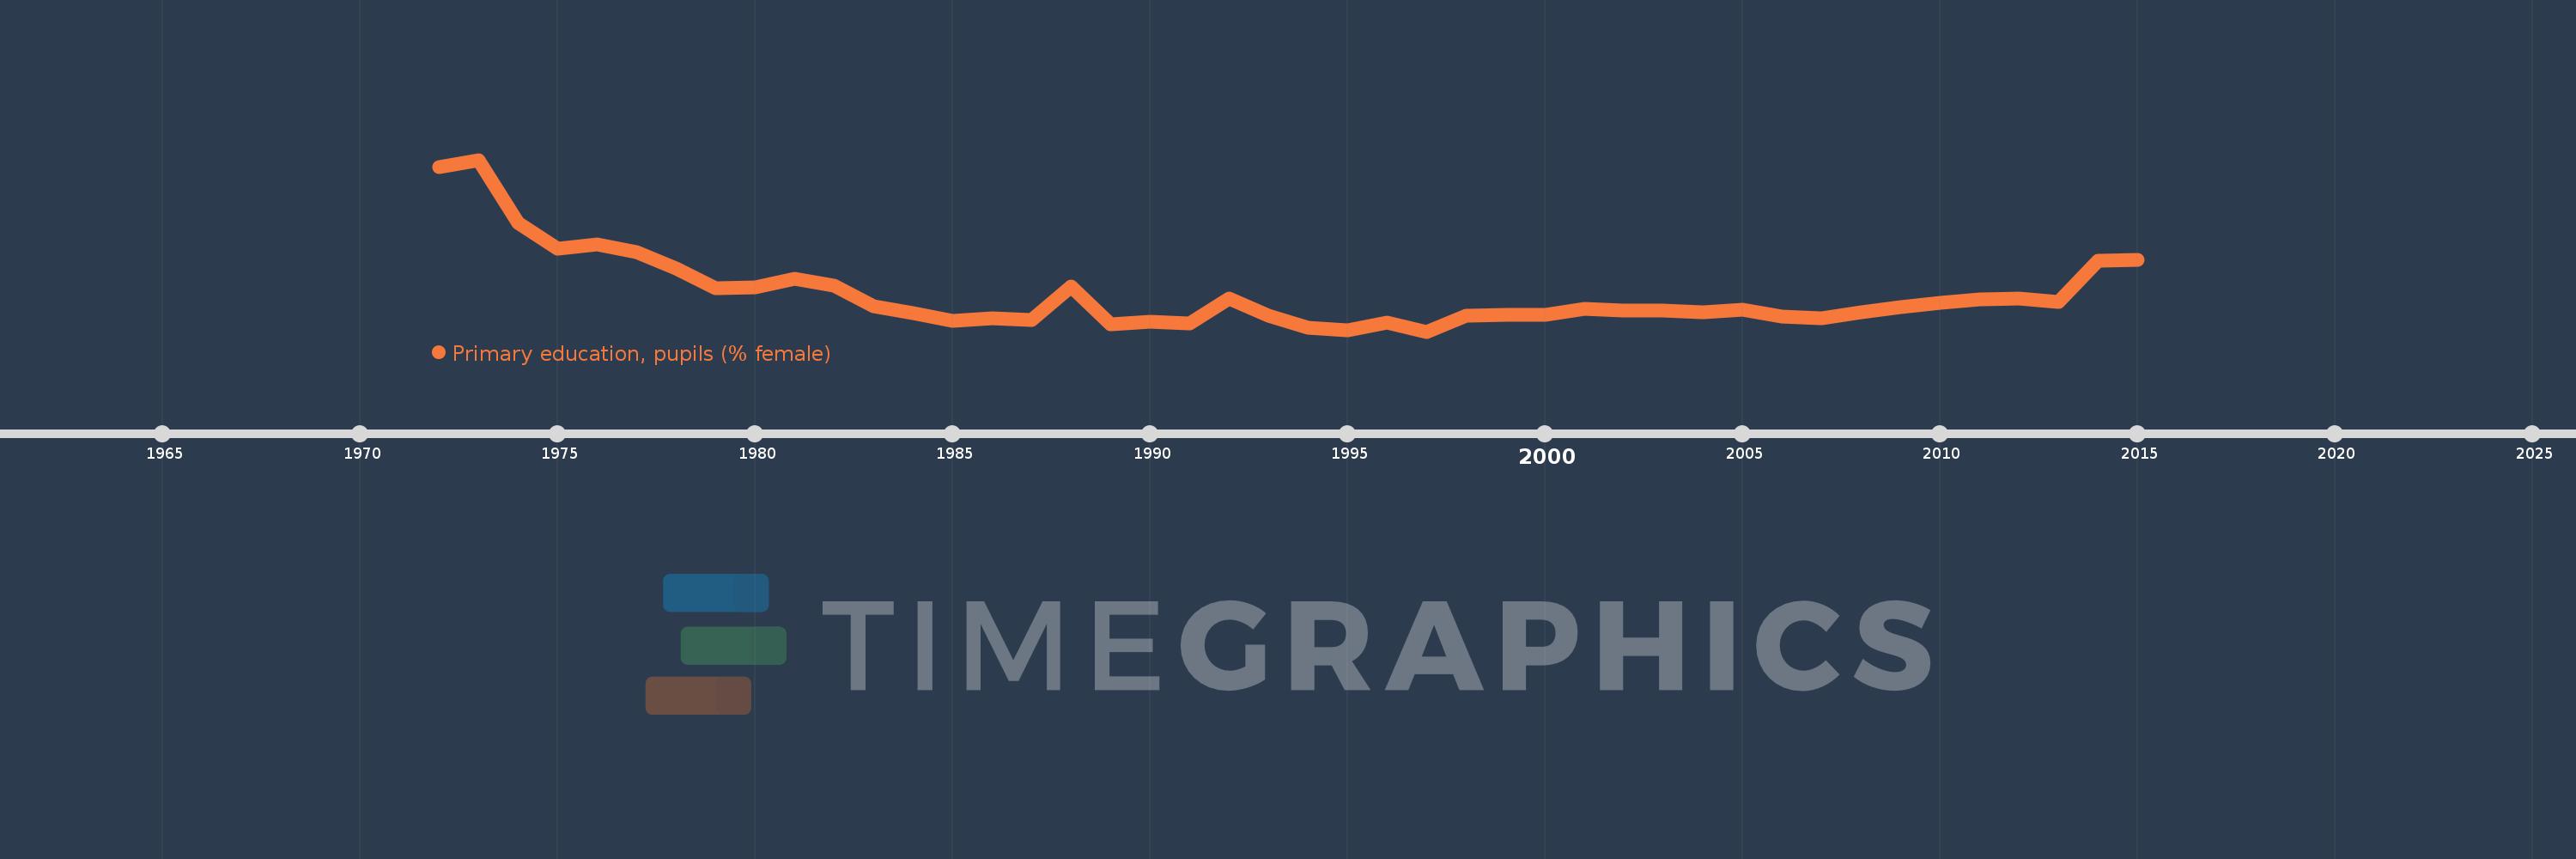
Primary education, pupils (% female)
2015,2014,2013,2012,2011,2010,2009,2008,2007,2006,2005,2004,2003,2002,2001,2000,1999,1998,1997,1996,1995,1994,1993,1992,1991,1990,1989,1988,1987,1986,1985,1984,1983,1982,1981,1980,1979,1978,1977,1976,1975,1974,1973,1972
Estas estatísticas em outros países:
AfghanistanAlbaniaAlgeriaAndorraAngolaAntigua and BarbudaArab WorldArgentinaArmeniaArubaAustraliaAustriaAzerbaijanBahamas, TheBahrainBangladeshBarbadosBelarusBelgiumBelizeBeninBermudaBhutanBoliviaBosnia and HerzegovinaBotswanaBrazilBritish Virgin IslandsBrunei DarussalamBulgariaBurkina FasoBurundiCabo VerdeCambodiaCameroonCanadaCaribbean small statesCayman IslandsCentral African RepublicCentral Europe and the BalticsChadChileChinaColombiaComorosCongo, Dem. Rep.Congo, Rep.Costa RicaCote d'IvoireCroatiaCubaCuracaoCyprusCzech RepublicDenmarkDjiboutiDominicaDominican RepublicEarly-demographic dividendEast Asia & PacificEast Asia & Pacific (excluding high income)East Asia & Pacific (IDA & IBRD countries)EcuadorEgypt, Arab Rep.El SalvadorEquatorial GuineaEritreaEstoniaEthiopiaEuro areaEurope & Central AsiaEurope & Central Asia (excluding high income)Europe & Central Asia (IDA & IBRD countries)European UnionFijiFinlandFragile and conflict affected situationsFranceGabonGambia, TheGeorgiaGermanyGhanaGibraltarGreeceGrenadaGuatemalaGuineaGuinea-BissauGuyanaHaitiHeavily indebted poor countries (HIPC)High incomeHondurasHong Kong SAR, ChinaHungaryIBRD onlyIcelandIDA & IBRD totalIDA blendIDA onlyIDA totalIndiaIndonesiaIran, Islamic Rep.IraqIrelandIsraelItalyJamaicaJapanJordanKazakhstanKenyaKiribatiKorea, Dem. People’s Rep.Korea, Rep.KuwaitKyrgyz RepublicLao PDRLate-demographic dividendLatin America & Caribbean Latin America & Caribbean (excluding high income)Latin America & the Caribbean (IDA & IBRD countries)LatviaLeast developed countries: UN classificationLebanonLesothoLiberiaLibyaLiechtensteinLithuaniaLow & middle incomeLow incomeLower middle incomeLuxembourgMacao SAR, ChinaMacedonia, FYRMadagascarMalawiMalaysiaMaldivesMaliMaltaMarshall IslandsMauritaniaMauritiusMexicoMicronesia, Fed. Sts.Middle East & North AfricaMiddle East & North Africa (excluding high income)Middle East & North Africa (IDA & IBRD countries)Middle incomeMoldovaMonacoMongoliaMontenegroMoroccoMozambiqueMyanmarNamibiaNauruNepalNetherlandsNew ZealandNicaraguaNigerNigeriaNorth AmericaNorwayOECD membersOmanOther small statesPacific island small statesPakistanPalauPanamaPapua New GuineaParaguayPeruPhilippinesPolandPortugalPost-demographic dividendPre-demographic dividendPuerto RicoQatarRomaniaRussian FederationRwandaSamoaSan MarinoSao Tome and PrincipeSaudi ArabiaSenegalSerbiaSeychellesSierra LeoneSingaporeSint Maarten (Dutch part)Slovak RepublicSloveniaSmall statesSolomon IslandsSomaliaSouth AfricaSouth AsiaSouth Asia (IDA & IBRD)South SudanSpainSri LankaSt. Kitts and NevisSt. LuciaSt. Vincent and the GrenadinesSub-Saharan Africa Sub-Saharan Africa (excluding high income)Sub-Saharan Africa (IDA & IBRD countries)SudanSurinameSwazilandSwedenSwitzerlandSyrian Arab RepublicTajikistanTanzaniaThailandTimor-LesteTogoTongaTrinidad and TobagoTunisiaTurkeyTurkmenistanTurks and Caicos IslandsTuvaluUgandaUkraineUnited Arab EmiratesUnited KingdomUnited StatesUpper middle incomeUruguayUzbekistanVanuatuVenezuela, RBVietnamWest Bank and GazaWorldYemen, Rep.ZambiaZimbabwe Linha do tempo:
Nesta escala de tempo está apresentado um gráfico de 1972 ano até 2015 ano Spain. Dados de 1971 ano ausente. O número de observações reais por data: 44.
Fonte (nome):
Indicadores de desenvolvimento mundial
Fonte (organização):
United Nations Educational, Scientific, and Cultural Organization (UNESCO) Institute for Statistics.
Categorias:
Education, Gender
Foi atualizado:
23 abr 2017 ano
Indicadores de alterações dos valores ao longo dos anos
Mínimo:
48.154
1 jan 1997 ano
Máximo:
49.747
1 jan 1973 ano
Na data de observação
Valor
Mudança absoluta
A alteração em relação ao valor anterior
1 jan 1972 ano
49.682
+49.682
0.0%
1 jan 1973 ano
49.747
+0.065
0.13%
1 jan 1974 ano
49.158
-0.59
-1.19%
1 jan 1975 ano
48.925
-0.233
-0.47%
1 jan 1976 ano
48.966
+0.041
0.08%
1 jan 1977 ano
48.892
-0.074
-0.15%
1 jan 1978 ano
48.743
-0.149
-0.3%
1 jan 1979 ano
48.557
-0.186
-0.38%
1 jan 1980 ano
48.561
+0.004
0.01%
1 jan 1981 ano
48.643
+0.082
0.17%
1 jan 1982 ano
48.579
-0.064
-0.13%
1 jan 1983 ano
48.387
-0.193
-0.4%
1 jan 1984 ano
48.328
-0.059
-0.12%
1 jan 1985 ano
48.257
-0.071
-0.15%
1 jan 1986 ano
48.278
+0.021
0.04%
1 jan 1987 ano
48.265
-0.012
-0.03%
1 jan 1988 ano
48.573
+0.308
0.64%
1 jan 1989 ano
48.221
-0.352
-0.73%
1 jan 1990 ano
48.243
+0.022
0.05%
1 jan 1991 ano
48.227
-0.016
-0.03%
1 jan 1992 ano
48.46
+0.234
0.48%
1 jan 1993 ano
48.303
-0.158
-0.33%
1 jan 1994 ano
48.193
-0.109
-0.23%
1 jan 1995 ano
48.168
-0.025
-0.05%
1 jan 1996 ano
48.237
+0.069
0.14%
1 jan 1997 ano
48.154
-0.083
-0.17%
1 jan 1998 ano
48.298
+0.143
0.3%
1 jan 1999 ano
48.31
+0.012
0.03%
1 jan 2000 ano
48.309
-0.001
0.0%
1 jan 2001 ano
48.362
+0.053
0.11%
1 jan 2002 ano
48.351
-0.011
-0.02%
1 jan 2003 ano
48.348
-0.003
-0.01%
1 jan 2004 ano
48.331
-0.017
-0.03%
1 jan 2005 ano
48.36
+0.029
0.06%
1 jan 2006 ano
48.291
-0.069
-0.14%
1 jan 2007 ano
48.281
-0.011
-0.02%
1 jan 2008 ano
48.335
+0.055
0.11%
1 jan 2009 ano
48.383
+0.048
0.1%
1 jan 2010 ano
48.417
+0.033
0.07%
1 jan 2011 ano
48.453
+0.036
0.07%
1 jan 2012 ano
48.46
+0.007
0.02%
1 jan 2013 ano
48.427
-0.034
-0.07%
1 jan 2014 ano
48.814
+0.387
0.8%
1 jan 2015 ano
48.821
+0.007
0.02%
Classificação de países por estatísticas atuais por anos


Comentários: