29
/pt/
pt
AIzaSyAYiBZKx7MnpbEhh9jyipgxe19OcubqV5w
April 1, 2024
37862
IDA & IBRD total
IBT
false
2
1
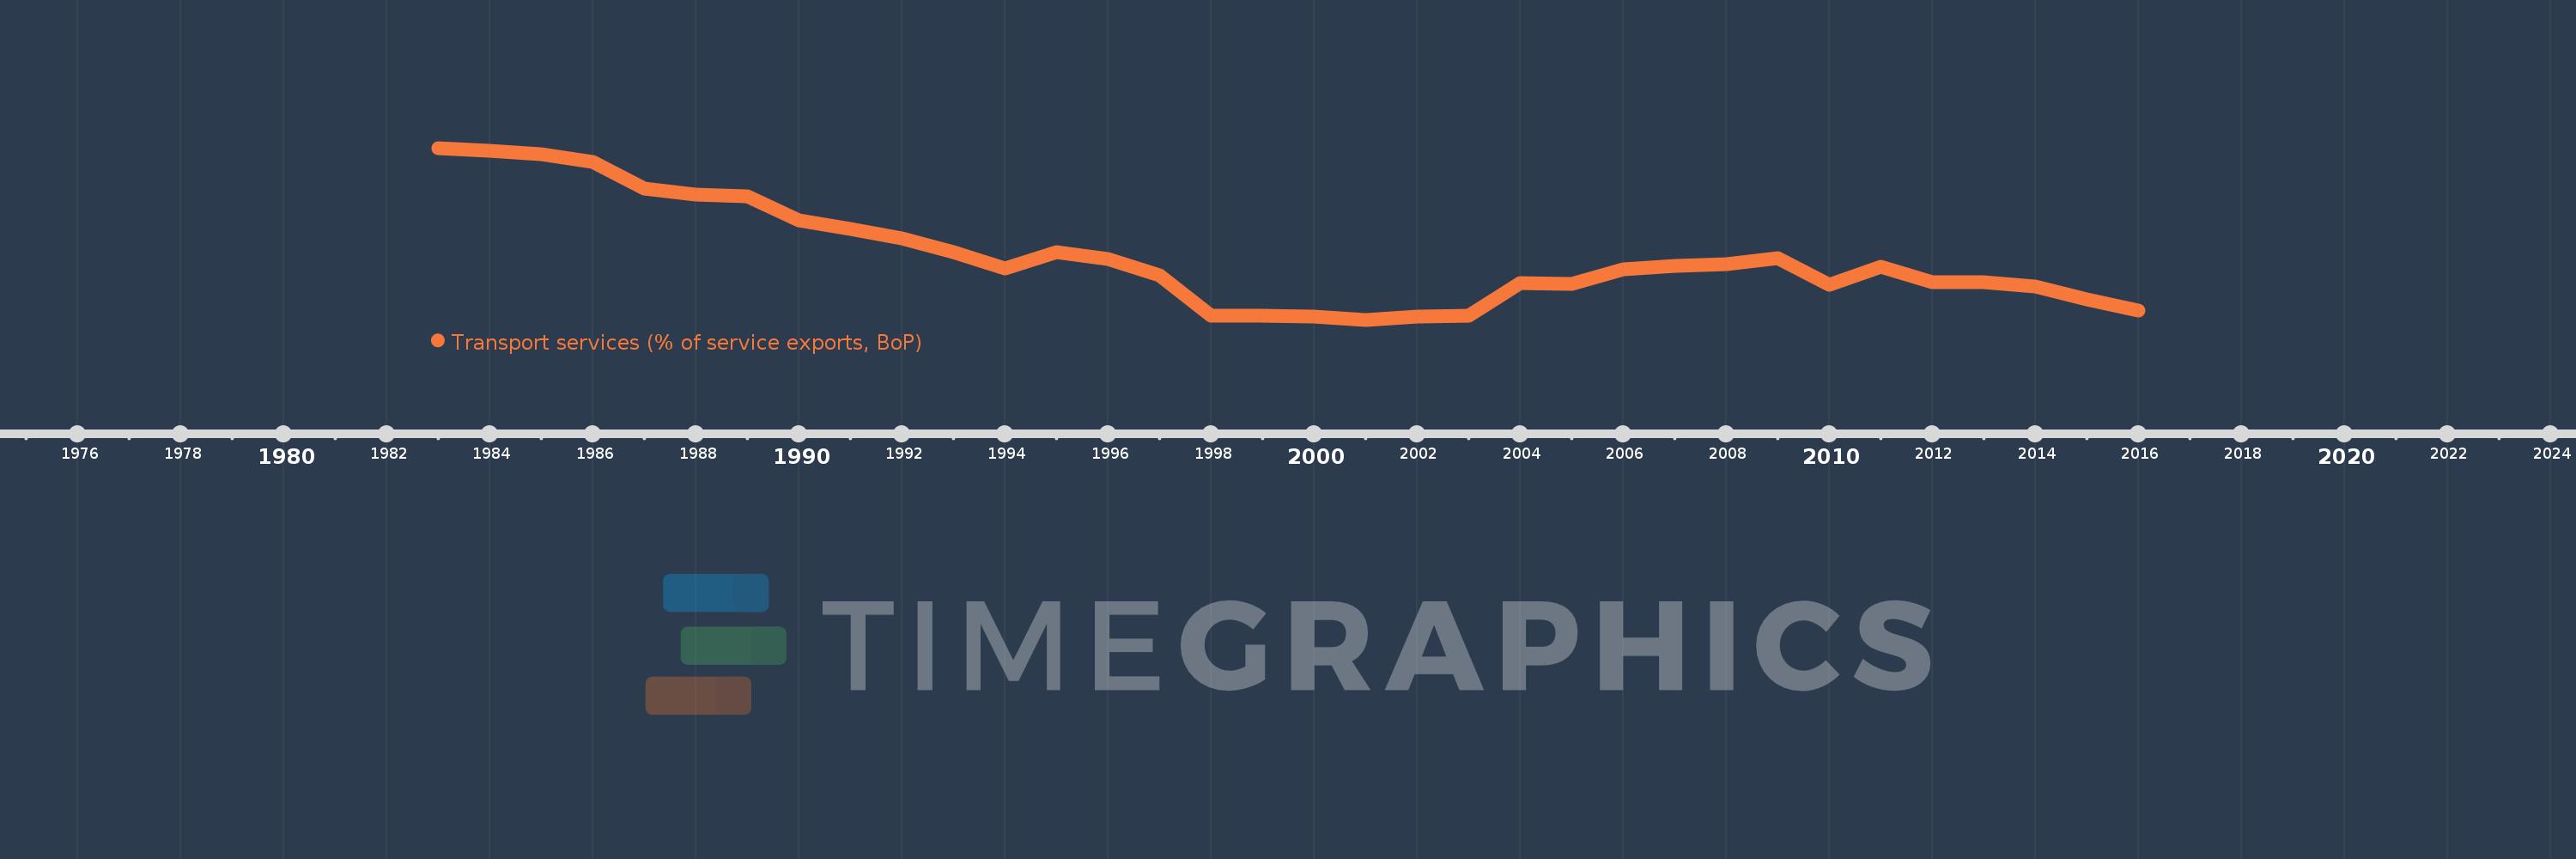
Transport services (% of service exports, BoP)
2016,2015,2014,2013,2012,2011,2010,2009,2008,2007,2006,2005,2004,2003,2002,2001,2000,1999,1998,1997,1996,1995,1994,1993,1992,1991,1990,1989,1988,1987,1986,1985,1984,1983
Estas estatísticas em outros países:
AfghanistanAlbaniaAlgeriaAngolaAntigua and BarbudaArab WorldArgentinaArmeniaArubaAustraliaAustriaAzerbaijanBahamas, TheBahrainBangladeshBarbadosBelarusBelgiumBelizeBeninBermudaBhutanBoliviaBosnia and HerzegovinaBotswanaBrazilBrunei DarussalamBulgariaBurkina FasoBurundiCabo VerdeCambodiaCameroonCanadaCaribbean small statesCentral African RepublicCentral Europe and the BalticsChadChileChinaColombiaComorosCongo, Dem. Rep.Congo, Rep.Costa RicaCote d'IvoireCroatiaCuracaoCyprusCzech RepublicDenmarkDjiboutiDominicaDominican RepublicEarly-demographic dividendEast Asia & PacificEast Asia & Pacific (excluding high income)East Asia & Pacific (IDA & IBRD countries)EcuadorEgypt, Arab Rep.El SalvadorEritreaEstoniaEthiopiaEuro areaEurope & Central AsiaEurope & Central Asia (excluding high income)Europe & Central Asia (IDA & IBRD countries)European UnionFaroe IslandsFijiFinlandFragile and conflict affected situationsFranceFrench PolynesiaGabonGambia, TheGeorgiaGermanyGhanaGreeceGrenadaGuatemalaGuineaGuinea-BissauGuyanaHaitiHeavily indebted poor countries (HIPC)High incomeHondurasHong Kong SAR, ChinaHungaryIBRD onlyIcelandIDA & IBRD totalIDA onlyIDA totalIndiaIndonesiaIran, Islamic Rep.IraqIrelandIsraelItalyJamaicaJapanJordanKazakhstanKenyaKiribatiKorea, Rep.KosovoKuwaitKyrgyz RepublicLao PDRLate-demographic dividendLatin America & Caribbean Latin America & Caribbean (excluding high income)Latin America & the Caribbean (IDA & IBRD countries)LatviaLeast developed countries: UN classificationLebanonLesothoLiberiaLibyaLithuaniaLow & middle incomeLow incomeLower middle incomeLuxembourgMacao SAR, ChinaMacedonia, FYRMadagascarMalawiMalaysiaMaldivesMaliMaltaMarshall IslandsMauritaniaMauritiusMexicoMicronesia, Fed. Sts.Middle East & North AfricaMiddle East & North Africa (excluding high income)Middle East & North Africa (IDA & IBRD countries)Middle incomeMoldovaMongoliaMontenegroMoroccoMozambiqueMyanmarNamibiaNepalNetherlandsNew CaledoniaNew ZealandNicaraguaNigerNigeriaNorth AmericaNorwayOECD membersOmanOther small statesPacific island small statesPakistanPalauPanamaPapua New GuineaParaguayPeruPhilippinesPolandPortugalPost-demographic dividendPre-demographic dividendQatarRomaniaRussian FederationRwandaSamoaSao Tome and PrincipeSaudi ArabiaSenegalSerbiaSeychellesSierra LeoneSingaporeSint Maarten (Dutch part)Slovak RepublicSloveniaSmall statesSolomon IslandsSouth AfricaSouth AsiaSouth Asia (IDA & IBRD)South SudanSpainSri LankaSt. Kitts and NevisSt. LuciaSt. Vincent and the GrenadinesSub-Saharan Africa Sub-Saharan Africa (excluding high income)Sub-Saharan Africa (IDA & IBRD countries)SudanSurinameSwazilandSwedenSwitzerlandSyrian Arab RepublicTajikistanTanzaniaThailandTimor-LesteTogoTongaTrinidad and TobagoTunisiaTurkeyTuvaluUgandaUkraineUnited KingdomUnited StatesUpper middle incomeUruguayVanuatuVenezuela, RBWest Bank and GazaWorldYemen, Rep.ZambiaZimbabwe Linha do tempo:
Nesta escala de tempo está apresentado um gráfico de 1983 ano até 2016 ano IDA & IBRD total. Dados de 1982 ano ausente. O número de observações reais por data: 34.
Fonte (nome):
Indicadores de desenvolvimento mundial
Fonte (organização):
International Monetary Fund, Balance of Payments Statistics Yearbook and data files.
Categorias:
Economy & Growth, Trade
Foi atualizado:
23 abr 2017 ano
Indicadores de alterações dos valores ao longo dos anos
Mínimo:
16.67
1 jan 2001 ano
Máximo:
32.892
1 jan 1983 ano
Na data de observação
Valor
Mudança absoluta
A alteração em relação ao valor anterior
1 jan 1983 ano
32.892
+32.892
0.0%
1 jan 1984 ano
32.628
-0.264
-0.8%
1 jan 1985 ano
32.327
-0.301
-0.92%
1 jan 1986 ano
31.602
-0.725
-2.24%
1 jan 1987 ano
29.059
-2.543
-8.05%
1 jan 1988 ano
28.527
-0.532
-1.83%
1 jan 1989 ano
28.341
-0.186
-0.65%
1 jan 1990 ano
26.053
-2.289
-8.08%
1 jan 1991 ano
25.281
-0.772
-2.96%
1 jan 1992 ano
24.322
-0.959
-3.79%
1 jan 1993 ano
23.043
-1.279
-5.26%
1 jan 1994 ano
21.488
-1.555
-6.75%
1 jan 1995 ano
23.073
+1.585
7.38%
1 jan 1996 ano
22.443
-0.63
-2.73%
1 jan 1997 ano
20.853
-1.59
-7.09%
1 jan 1998 ano
17.064
-3.788
-18.17%
1 jan 1999 ano
17.033
-0.032
-0.18%
1 jan 2000 ano
16.971
-0.061
-0.36%
1 jan 2001 ano
16.67
-0.302
-1.78%
1 jan 2002 ano
16.964
+0.294
1.76%
1 jan 2003 ano
17.016
+0.053
0.31%
1 jan 2004 ano
20.156
+3.14
18.45%
1 jan 2005 ano
20.088
-0.068
-0.34%
1 jan 2006 ano
21.412
+1.324
6.59%
1 jan 2007 ano
21.75
+0.338
1.58%
1 jan 2008 ano
21.946
+0.196
0.9%
1 jan 2009 ano
22.45
+0.503
2.29%
1 jan 2010 ano
20.004
-2.446
-10.89%
1 jan 2011 ano
21.671
+1.667
8.34%
1 jan 2012 ano
20.177
-1.494
-6.89%
1 jan 2013 ano
20.236
+0.058
0.29%
1 jan 2014 ano
19.774
-0.462
-2.28%
1 jan 2015 ano
18.601
-1.172
-5.93%
1 jan 2016 ano
17.508
-1.094
-5.88%
Classificação de países por estatísticas atuais por anos


Comentários: