29
/pt/
pt
AIzaSyAYiBZKx7MnpbEhh9jyipgxe19OcubqV5w
April 1, 2024
117515
Cyprus
CYP
true
2
1
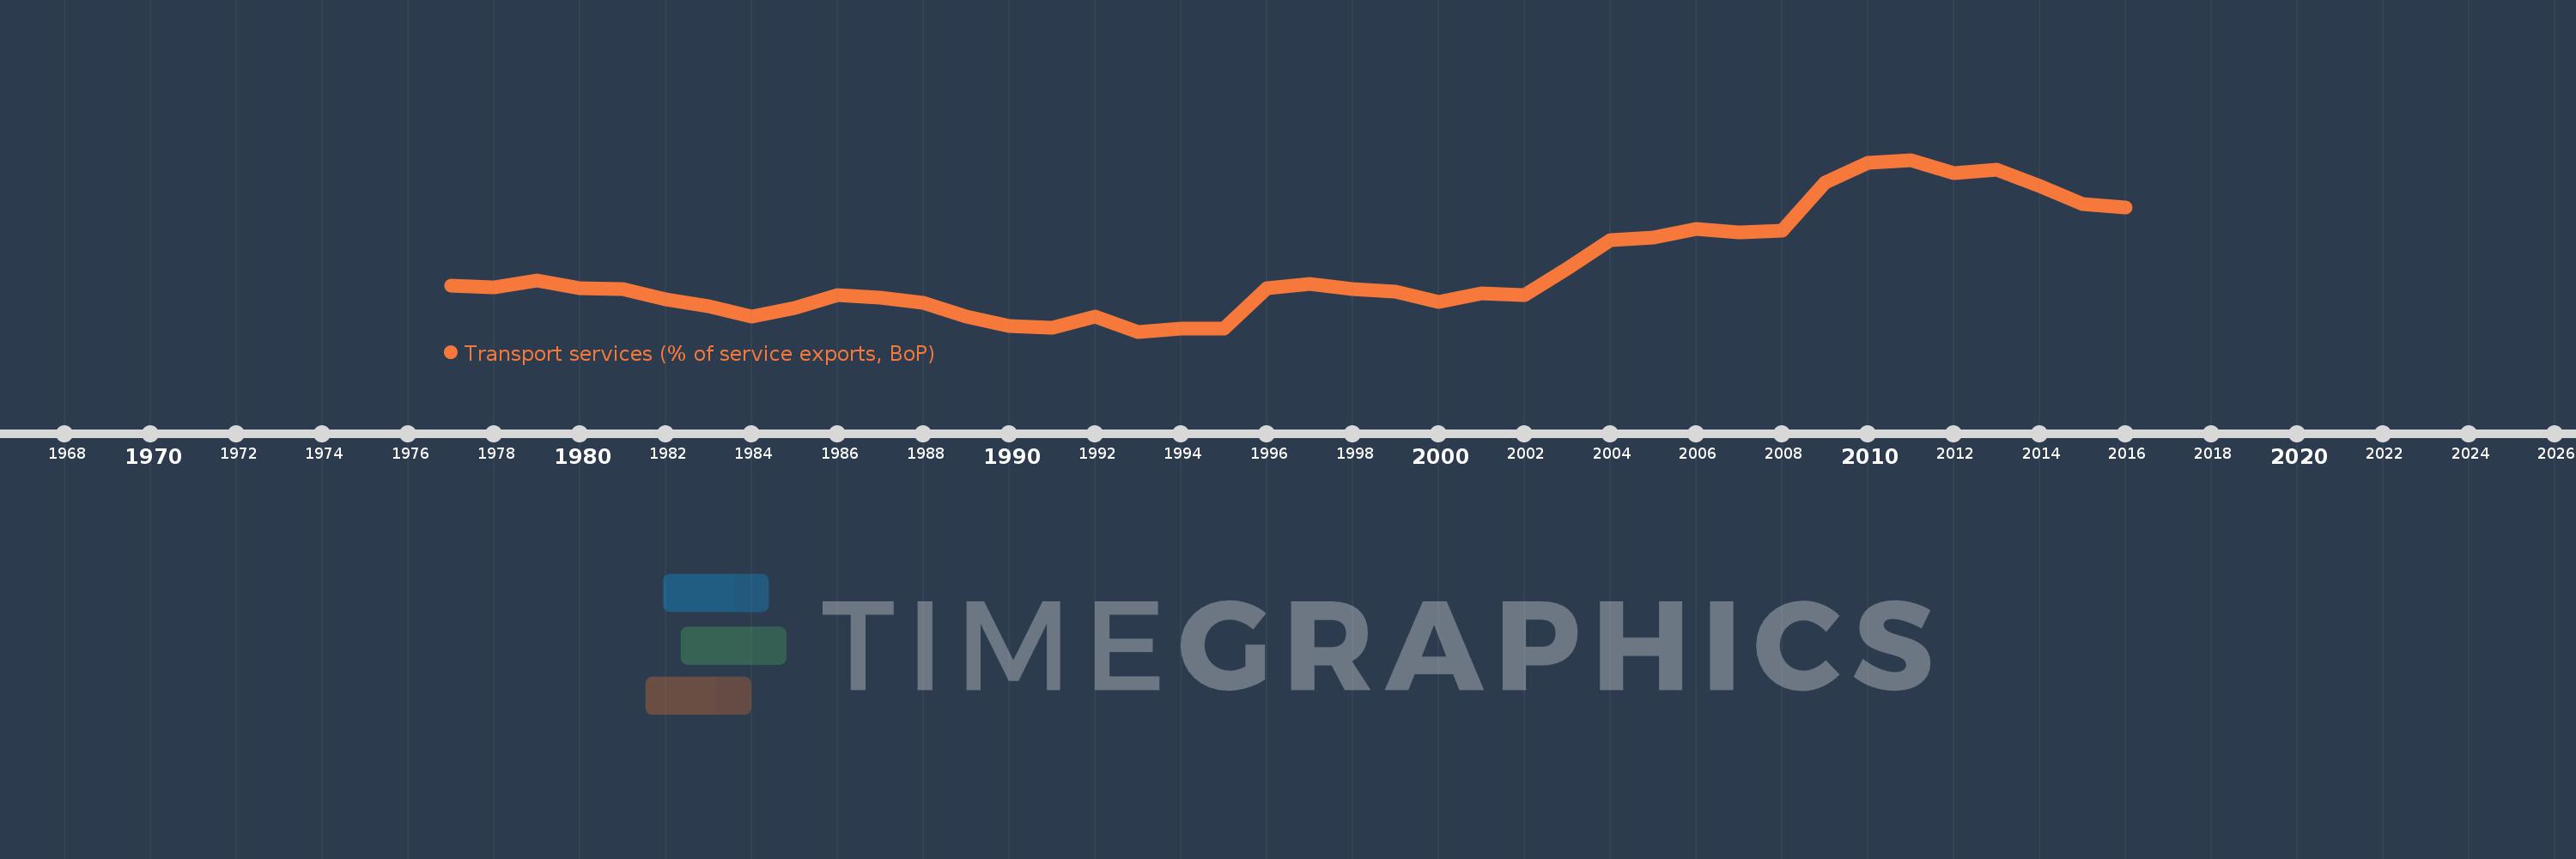
Transport services (% of service exports, BoP)
2016,2015,2014,2013,2012,2011,2010,2009,2008,2007,2006,2005,2004,2003,2002,2001,2000,1999,1998,1997,1996,1995,1994,1993,1992,1991,1990,1989,1988,1987,1986,1985,1984,1983,1982,1981,1980,1979,1978,1977
Estas estatísticas em outros países:
AfghanistanAlbaniaAlgeriaAngolaAntigua and BarbudaArab WorldArgentinaArmeniaArubaAustraliaAustriaAzerbaijanBahamas, TheBahrainBangladeshBarbadosBelarusBelgiumBelizeBeninBermudaBhutanBoliviaBosnia and HerzegovinaBotswanaBrazilBrunei DarussalamBulgariaBurkina FasoBurundiCabo VerdeCambodiaCameroonCanadaCaribbean small statesCentral African RepublicCentral Europe and the BalticsChadChileChinaColombiaComorosCongo, Dem. Rep.Congo, Rep.Costa RicaCote d'IvoireCroatiaCuracaoCyprusCzech RepublicDenmarkDjiboutiDominicaDominican RepublicEarly-demographic dividendEast Asia & PacificEast Asia & Pacific (excluding high income)East Asia & Pacific (IDA & IBRD countries)EcuadorEgypt, Arab Rep.El SalvadorEritreaEstoniaEthiopiaEuro areaEurope & Central AsiaEurope & Central Asia (excluding high income)Europe & Central Asia (IDA & IBRD countries)European UnionFaroe IslandsFijiFinlandFragile and conflict affected situationsFranceFrench PolynesiaGabonGambia, TheGeorgiaGermanyGhanaGreeceGrenadaGuatemalaGuineaGuinea-BissauGuyanaHaitiHeavily indebted poor countries (HIPC)High incomeHondurasHong Kong SAR, ChinaHungaryIBRD onlyIcelandIDA & IBRD totalIDA onlyIDA totalIndiaIndonesiaIran, Islamic Rep.IraqIrelandIsraelItalyJamaicaJapanJordanKazakhstanKenyaKiribatiKorea, Rep.KosovoKuwaitKyrgyz RepublicLao PDRLate-demographic dividendLatin America & Caribbean Latin America & Caribbean (excluding high income)Latin America & the Caribbean (IDA & IBRD countries)LatviaLeast developed countries: UN classificationLebanonLesothoLiberiaLibyaLithuaniaLow & middle incomeLow incomeLower middle incomeLuxembourgMacao SAR, ChinaMacedonia, FYRMadagascarMalawiMalaysiaMaldivesMaliMaltaMarshall IslandsMauritaniaMauritiusMexicoMicronesia, Fed. Sts.Middle East & North AfricaMiddle East & North Africa (excluding high income)Middle East & North Africa (IDA & IBRD countries)Middle incomeMoldovaMongoliaMontenegroMoroccoMozambiqueMyanmarNamibiaNepalNetherlandsNew CaledoniaNew ZealandNicaraguaNigerNigeriaNorth AmericaNorwayOECD membersOmanOther small statesPacific island small statesPakistanPalauPanamaPapua New GuineaParaguayPeruPhilippinesPolandPortugalPost-demographic dividendPre-demographic dividendQatarRomaniaRussian FederationRwandaSamoaSao Tome and PrincipeSaudi ArabiaSenegalSerbiaSeychellesSierra LeoneSingaporeSint Maarten (Dutch part)Slovak RepublicSloveniaSmall statesSolomon IslandsSouth AfricaSouth AsiaSouth Asia (IDA & IBRD)South SudanSpainSri LankaSt. Kitts and NevisSt. LuciaSt. Vincent and the GrenadinesSub-Saharan Africa Sub-Saharan Africa (excluding high income)Sub-Saharan Africa (IDA & IBRD countries)SudanSurinameSwazilandSwedenSwitzerlandSyrian Arab RepublicTajikistanTanzaniaThailandTimor-LesteTogoTongaTrinidad and TobagoTunisiaTurkeyTuvaluUgandaUkraineUnited KingdomUnited StatesUpper middle incomeUruguayVanuatuVenezuela, RBWest Bank and GazaWorldYemen, Rep.ZambiaZimbabwe Linha do tempo:
Nesta escala de tempo está apresentado um gráfico de 1977 ano até 2016 ano Cyprus. Dados de 1976 ano ausente. O número de observações reais por data: 40.
Fonte (nome):
Indicadores de desenvolvimento mundial
Fonte (organização):
International Monetary Fund, Balance of Payments Statistics Yearbook and data files.
Categorias:
Economy & Growth, Trade
Foi atualizado:
23 abr 2017 ano
Indicadores de alterações dos valores ao longo dos anos
Mínimo:
12.554
1 jan 1993 ano
Máximo:
34.674
1 jan 2011 ano
Na data de observação
Valor
Mudança absoluta
A alteração em relação ao valor anterior
1 jan 1977 ano
18.421
+18.421
0.0%
1 jan 1978 ano
18.268
-0.153
-0.83%
1 jan 1979 ano
19.151
+0.883
4.83%
1 jan 1980 ano
18.085
-1.066
-5.57%
1 jan 1981 ano
18.048
-0.037
-0.2%
1 jan 1982 ano
16.719
-1.329
-7.36%
1 jan 1983 ano
15.853
-0.866
-5.18%
1 jan 1984 ano
14.467
-1.385
-8.74%
1 jan 1985 ano
15.649
+1.182
8.17%
1 jan 1986 ano
17.289
+1.64
10.48%
1 jan 1987 ano
16.883
-0.407
-2.35%
1 jan 1988 ano
16.22
-0.662
-3.92%
1 jan 1989 ano
14.498
-1.722
-10.62%
1 jan 1990 ano
13.29
-1.208
-8.33%
1 jan 1991 ano
12.998
-0.292
-2.19%
1 jan 1992 ano
14.47
+1.471
11.32%
1 jan 1993 ano
12.554
-1.916
-13.24%
1 jan 1994 ano
12.923
+0.369
2.94%
1 jan 1995 ano
12.981
+0.058
0.45%
1 jan 1996 ano
18.179
+5.199
40.05%
1 jan 1997 ano
18.647
+0.468
2.57%
1 jan 1998 ano
18.063
-0.584
-3.13%
1 jan 1999 ano
17.728
-0.335
-1.85%
1 jan 2000 ano
16.379
-1.349
-7.61%
1 jan 2001 ano
17.425
+1.046
6.39%
1 jan 2002 ano
17.297
-0.128
-0.73%
1 jan 2003 ano
20.693
+3.395
19.63%
1 jan 2004 ano
24.322
+3.63
17.54%
1 jan 2005 ano
24.67
+0.348
1.43%
1 jan 2006 ano
25.783
+1.113
4.51%
1 jan 2007 ano
25.307
-0.476
-1.85%
1 jan 2008 ano
25.596
+0.289
1.14%
1 jan 2009 ano
31.706
+6.11
23.87%
1 jan 2010 ano
34.284
+2.578
8.13%
1 jan 2011 ano
34.674
+0.39
1.14%
1 jan 2012 ano
33.005
-1.67
-4.82%
1 jan 2013 ano
33.419
+0.414
1.25%
1 jan 2014 ano
31.297
-2.122
-6.35%
1 jan 2015 ano
28.986
-2.311
-7.38%
1 jan 2016 ano
28.532
-0.453
-1.56%
Classificação de países por estatísticas atuais por anos


Comentários: