29
/pt/
pt
AIzaSyAYiBZKx7MnpbEhh9jyipgxe19OcubqV5w
April 1, 2024
217269
Pakistan
PAK
true
2
1
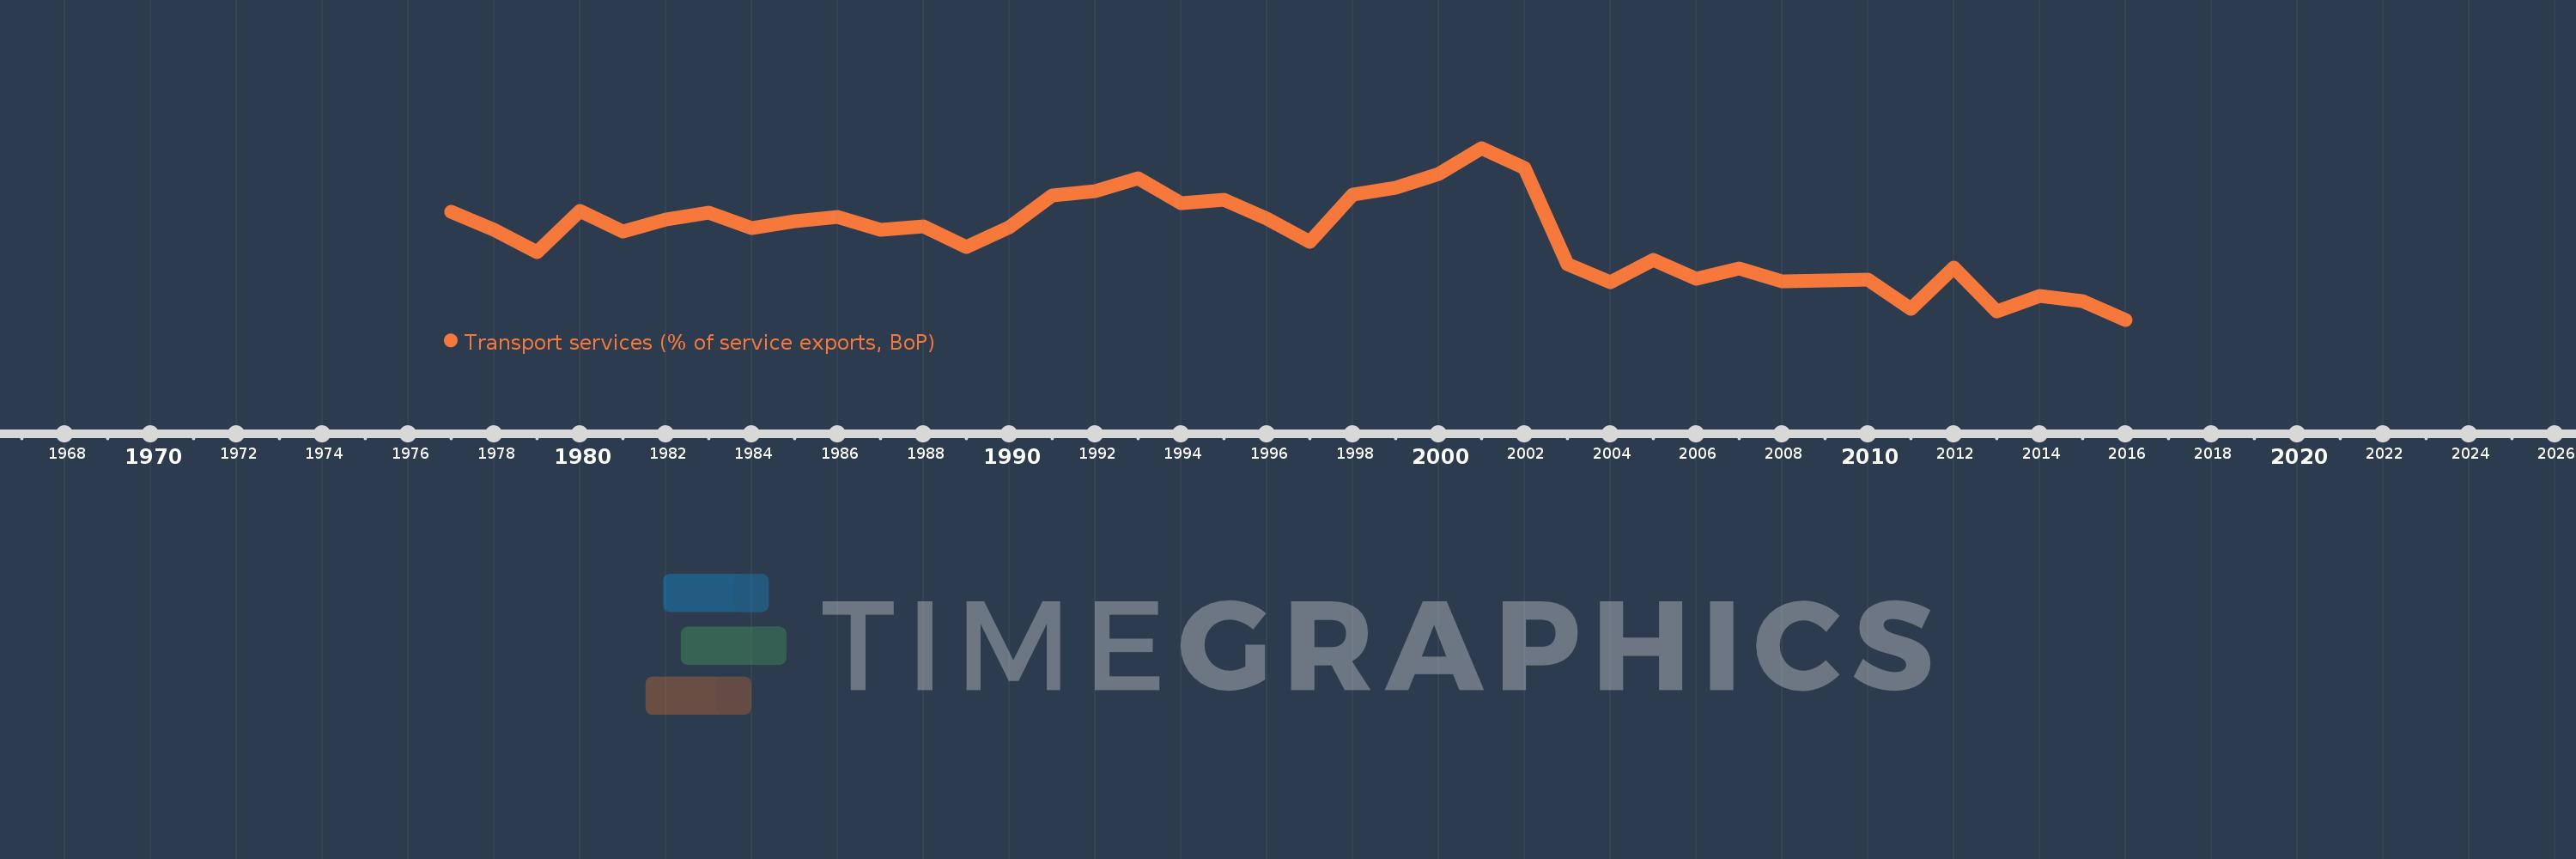
Transport services (% of service exports, BoP)
2016,2015,2014,2013,2012,2011,2010,2009,2008,2007,2006,2005,2004,2003,2002,2001,2000,1999,1998,1997,1996,1995,1994,1993,1992,1991,1990,1989,1988,1987,1986,1985,1984,1983,1982,1981,1980,1979,1978,1977
Estas estatísticas em outros países:
AfghanistanAlbaniaAlgeriaAngolaAntigua and BarbudaArab WorldArgentinaArmeniaArubaAustraliaAustriaAzerbaijanBahamas, TheBahrainBangladeshBarbadosBelarusBelgiumBelizeBeninBermudaBhutanBoliviaBosnia and HerzegovinaBotswanaBrazilBrunei DarussalamBulgariaBurkina FasoBurundiCabo VerdeCambodiaCameroonCanadaCaribbean small statesCentral African RepublicCentral Europe and the BalticsChadChileChinaColombiaComorosCongo, Dem. Rep.Congo, Rep.Costa RicaCote d'IvoireCroatiaCuracaoCyprusCzech RepublicDenmarkDjiboutiDominicaDominican RepublicEarly-demographic dividendEast Asia & PacificEast Asia & Pacific (excluding high income)East Asia & Pacific (IDA & IBRD countries)EcuadorEgypt, Arab Rep.El SalvadorEritreaEstoniaEthiopiaEuro areaEurope & Central AsiaEurope & Central Asia (excluding high income)Europe & Central Asia (IDA & IBRD countries)European UnionFaroe IslandsFijiFinlandFragile and conflict affected situationsFranceFrench PolynesiaGabonGambia, TheGeorgiaGermanyGhanaGreeceGrenadaGuatemalaGuineaGuinea-BissauGuyanaHaitiHeavily indebted poor countries (HIPC)High incomeHondurasHong Kong SAR, ChinaHungaryIBRD onlyIcelandIDA & IBRD totalIDA onlyIDA totalIndiaIndonesiaIran, Islamic Rep.IraqIrelandIsraelItalyJamaicaJapanJordanKazakhstanKenyaKiribatiKorea, Rep.KosovoKuwaitKyrgyz RepublicLao PDRLate-demographic dividendLatin America & Caribbean Latin America & Caribbean (excluding high income)Latin America & the Caribbean (IDA & IBRD countries)LatviaLeast developed countries: UN classificationLebanonLesothoLiberiaLibyaLithuaniaLow & middle incomeLow incomeLower middle incomeLuxembourgMacao SAR, ChinaMacedonia, FYRMadagascarMalawiMalaysiaMaldivesMaliMaltaMarshall IslandsMauritaniaMauritiusMexicoMicronesia, Fed. Sts.Middle East & North AfricaMiddle East & North Africa (excluding high income)Middle East & North Africa (IDA & IBRD countries)Middle incomeMoldovaMongoliaMontenegroMoroccoMozambiqueMyanmarNamibiaNepalNetherlandsNew CaledoniaNew ZealandNicaraguaNigerNigeriaNorth AmericaNorwayOECD membersOmanOther small statesPacific island small statesPakistanPalauPanamaPapua New GuineaParaguayPeruPhilippinesPolandPortugalPost-demographic dividendPre-demographic dividendQatarRomaniaRussian FederationRwandaSamoaSao Tome and PrincipeSaudi ArabiaSenegalSerbiaSeychellesSierra LeoneSingaporeSint Maarten (Dutch part)Slovak RepublicSloveniaSmall statesSolomon IslandsSouth AfricaSouth AsiaSouth Asia (IDA & IBRD)South SudanSpainSri LankaSt. Kitts and NevisSt. LuciaSt. Vincent and the GrenadinesSub-Saharan Africa Sub-Saharan Africa (excluding high income)Sub-Saharan Africa (IDA & IBRD countries)SudanSurinameSwazilandSwedenSwitzerlandSyrian Arab RepublicTajikistanTanzaniaThailandTimor-LesteTogoTongaTrinidad and TobagoTunisiaTurkeyTuvaluUgandaUkraineUnited KingdomUnited StatesUpper middle incomeUruguayVanuatuVenezuela, RBWest Bank and GazaWorldYemen, Rep.ZambiaZimbabwe Linha do tempo:
Nesta escala de tempo está apresentado um gráfico de 1977 ano até 2016 ano Pakistan. Dados de 1976 ano ausente. O número de observações reais por data: 40.
Fonte (nome):
Indicadores de desenvolvimento mundial
Fonte (organização):
International Monetary Fund, Balance of Payments Statistics Yearbook and data files.
Categorias:
Economy & Growth, Trade
Foi atualizado:
23 abr 2017 ano
Indicadores de alterações dos valores ao longo dos anos
Mínimo:
18.959
1 jan 2016 ano
Máximo:
62.687
1 jan 2001 ano
Na data de observação
Valor
Mudança absoluta
A alteração em relação ao valor anterior
1 jan 1977 ano
46.455
+46.455
0.0%
1 jan 1978 ano
41.862
-4.593
-9.89%
1 jan 1979 ano
36.102
-5.76
-13.76%
1 jan 1980 ano
46.678
+10.576
29.29%
1 jan 1981 ano
41.329
-5.348
-11.46%
1 jan 1982 ano
44.481
+3.152
7.63%
1 jan 1983 ano
46.188
+1.707
3.84%
1 jan 1984 ano
42.268
-3.921
-8.49%
1 jan 1985 ano
44.141
+1.874
4.43%
1 jan 1986 ano
45.153
+1.012
2.29%
1 jan 1987 ano
41.907
-3.246
-7.19%
1 jan 1988 ano
42.822
+0.914
2.18%
1 jan 1989 ano
37.467
-5.354
-12.5%
1 jan 1990 ano
42.566
+5.098
13.61%
1 jan 1991 ano
50.511
+7.945
18.67%
1 jan 1992 ano
51.583
+1.072
2.12%
1 jan 1993 ano
55.027
+3.444
6.68%
1 jan 1994 ano
48.706
-6.322
-11.49%
1 jan 1995 ano
49.569
+0.864
1.77%
1 jan 1996 ano
44.686
-4.884
-9.85%
1 jan 1997 ano
38.768
-5.917
-13.24%
1 jan 1998 ano
50.774
+12.005
30.97%
1 jan 1999 ano
52.612
+1.839
3.62%
1 jan 2000 ano
56.09
+3.478
6.61%
1 jan 2001 ano
62.687
+6.596
11.76%
1 jan 2002 ano
57.687
-5.0
-7.98%
1 jan 2003 ano
33.208
-24.479
-42.43%
1 jan 2004 ano
28.479
-4.728
-14.24%
1 jan 2005 ano
34.231
+5.752
20.2%
1 jan 2006 ano
29.367
-4.865
-14.21%
1 jan 2007 ano
32.029
+2.662
9.06%
1 jan 2008 ano
28.675
-3.354
-10.47%
1 jan 2009 ano
28.877
+0.202
0.71%
1 jan 2010 ano
29.189
+0.311
1.08%
1 jan 2011 ano
21.658
-7.531
-25.8%
1 jan 2012 ano
32.321
+10.663
49.24%
1 jan 2013 ano
20.981
-11.34
-35.08%
1 jan 2014 ano
25.081
+4.1
19.54%
1 jan 2015 ano
23.596
-1.485
-5.92%
1 jan 2016 ano
18.959
-4.637
-19.65%
Classificação de países por estatísticas atuais por anos


Comentários: