29
/pt/
pt
AIzaSyAYiBZKx7MnpbEhh9jyipgxe19OcubqV5w
April 1, 2024
165656
Jordan
JOR
true
2
1
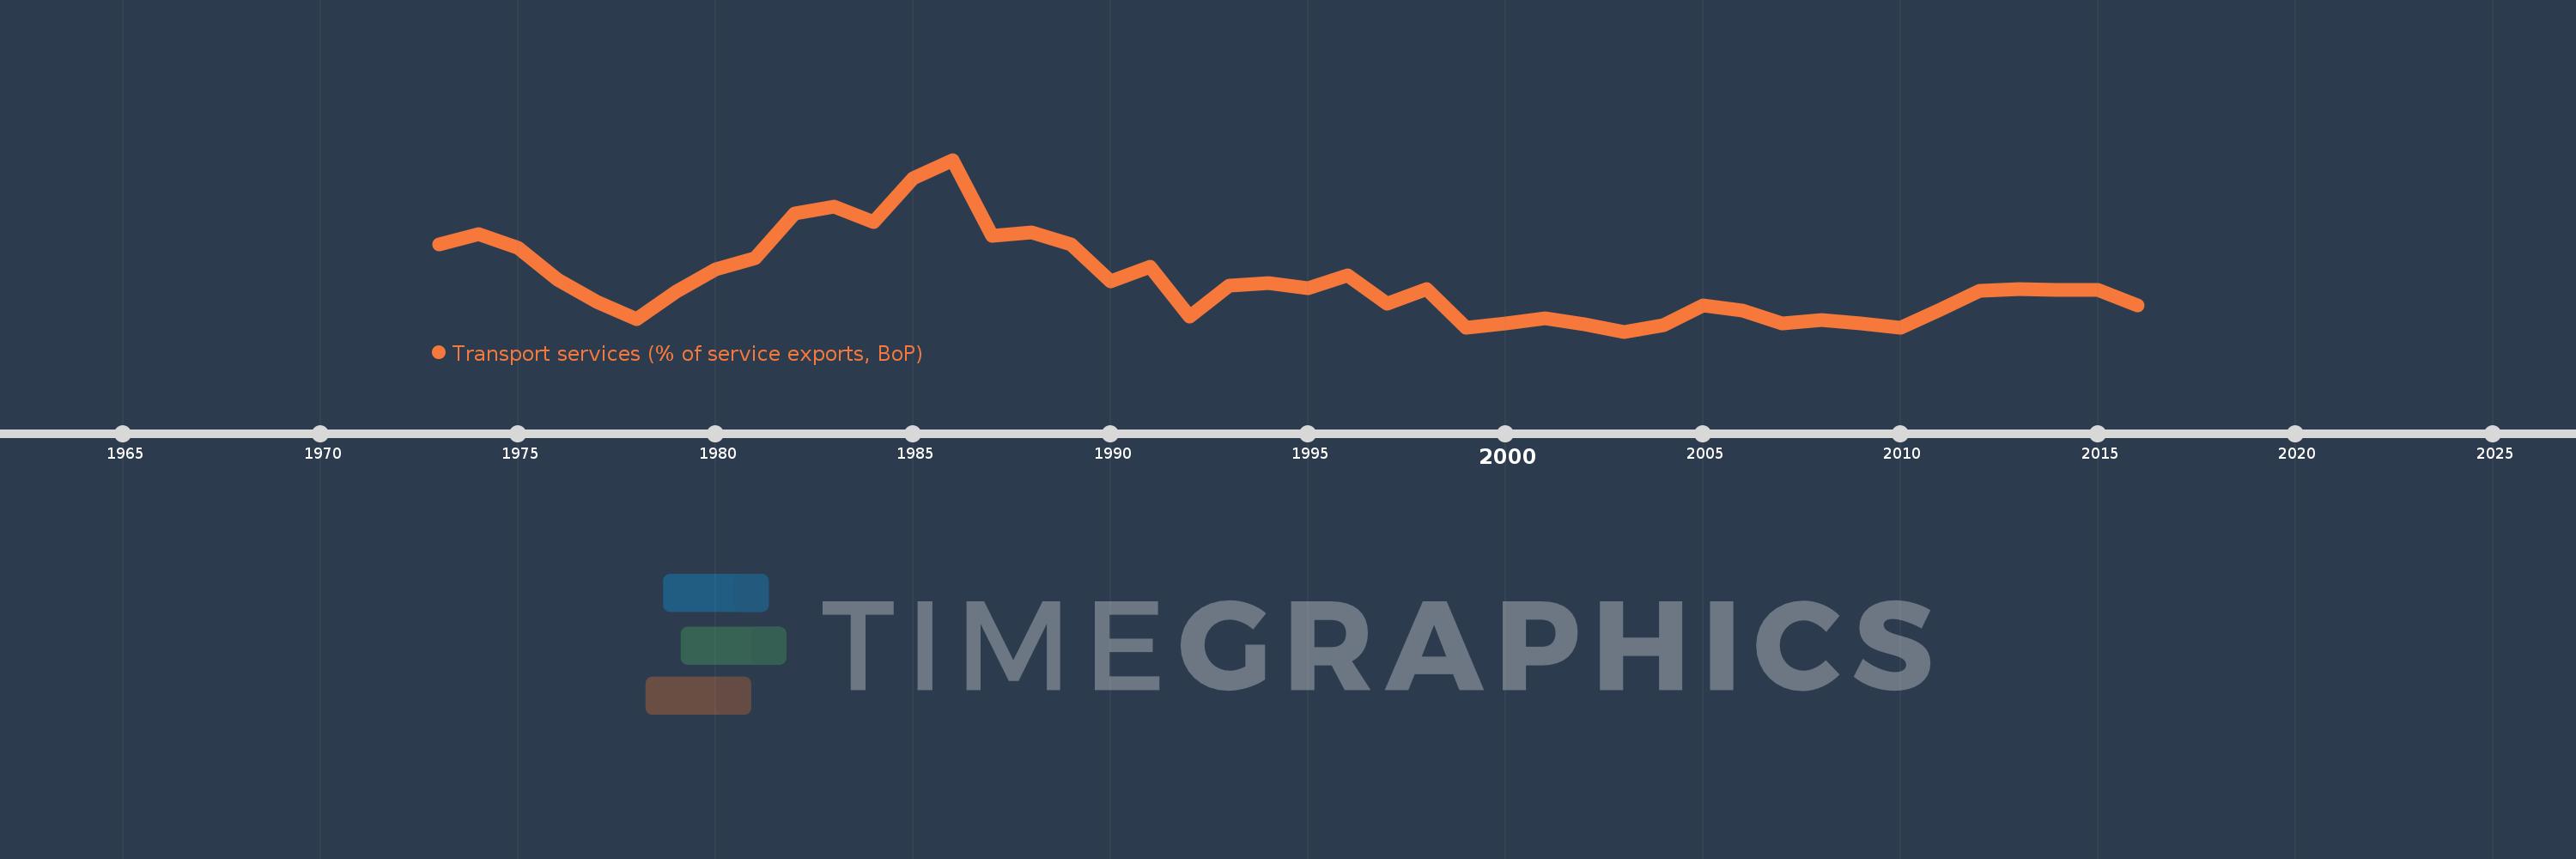
Transport services (% of service exports, BoP)
2016,2015,2014,2013,2012,2011,2010,2009,2008,2007,2006,2005,2004,2003,2002,2001,2000,1999,1998,1997,1996,1995,1994,1993,1992,1991,1990,1989,1988,1987,1986,1985,1984,1983,1982,1981,1980,1979,1978,1977,1976,1975,1974,1973
Estas estatísticas em outros países:
AfghanistanAlbaniaAlgeriaAngolaAntigua and BarbudaArab WorldArgentinaArmeniaArubaAustraliaAustriaAzerbaijanBahamas, TheBahrainBangladeshBarbadosBelarusBelgiumBelizeBeninBermudaBhutanBoliviaBosnia and HerzegovinaBotswanaBrazilBrunei DarussalamBulgariaBurkina FasoBurundiCabo VerdeCambodiaCameroonCanadaCaribbean small statesCentral African RepublicCentral Europe and the BalticsChadChileChinaColombiaComorosCongo, Dem. Rep.Congo, Rep.Costa RicaCote d'IvoireCroatiaCuracaoCyprusCzech RepublicDenmarkDjiboutiDominicaDominican RepublicEarly-demographic dividendEast Asia & PacificEast Asia & Pacific (excluding high income)East Asia & Pacific (IDA & IBRD countries)EcuadorEgypt, Arab Rep.El SalvadorEritreaEstoniaEthiopiaEuro areaEurope & Central AsiaEurope & Central Asia (excluding high income)Europe & Central Asia (IDA & IBRD countries)European UnionFaroe IslandsFijiFinlandFragile and conflict affected situationsFranceFrench PolynesiaGabonGambia, TheGeorgiaGermanyGhanaGreeceGrenadaGuatemalaGuineaGuinea-BissauGuyanaHaitiHeavily indebted poor countries (HIPC)High incomeHondurasHong Kong SAR, ChinaHungaryIBRD onlyIcelandIDA & IBRD totalIDA onlyIDA totalIndiaIndonesiaIran, Islamic Rep.IraqIrelandIsraelItalyJamaicaJapanJordanKazakhstanKenyaKiribatiKorea, Rep.KosovoKuwaitKyrgyz RepublicLao PDRLate-demographic dividendLatin America & Caribbean Latin America & Caribbean (excluding high income)Latin America & the Caribbean (IDA & IBRD countries)LatviaLeast developed countries: UN classificationLebanonLesothoLiberiaLibyaLithuaniaLow & middle incomeLow incomeLower middle incomeLuxembourgMacao SAR, ChinaMacedonia, FYRMadagascarMalawiMalaysiaMaldivesMaliMaltaMarshall IslandsMauritaniaMauritiusMexicoMicronesia, Fed. Sts.Middle East & North AfricaMiddle East & North Africa (excluding high income)Middle East & North Africa (IDA & IBRD countries)Middle incomeMoldovaMongoliaMontenegroMoroccoMozambiqueMyanmarNamibiaNepalNetherlandsNew CaledoniaNew ZealandNicaraguaNigerNigeriaNorth AmericaNorwayOECD membersOmanOther small statesPacific island small statesPakistanPalauPanamaPapua New GuineaParaguayPeruPhilippinesPolandPortugalPost-demographic dividendPre-demographic dividendQatarRomaniaRussian FederationRwandaSamoaSao Tome and PrincipeSaudi ArabiaSenegalSerbiaSeychellesSierra LeoneSingaporeSint Maarten (Dutch part)Slovak RepublicSloveniaSmall statesSolomon IslandsSouth AfricaSouth AsiaSouth Asia (IDA & IBRD)South SudanSpainSri LankaSt. Kitts and NevisSt. LuciaSt. Vincent and the GrenadinesSub-Saharan Africa Sub-Saharan Africa (excluding high income)Sub-Saharan Africa (IDA & IBRD countries)SudanSurinameSwazilandSwedenSwitzerlandSyrian Arab RepublicTajikistanTanzaniaThailandTimor-LesteTogoTongaTrinidad and TobagoTunisiaTurkeyTuvaluUgandaUkraineUnited KingdomUnited StatesUpper middle incomeUruguayVanuatuVenezuela, RBWest Bank and GazaWorldYemen, Rep.ZambiaZimbabwe Linha do tempo:
Nesta escala de tempo está apresentado um gráfico de 1973 ano até 2016 ano Jordan. Dados de 1972 ano ausente. O número de observações reais por data: 44.
Fonte (nome):
Indicadores de desenvolvimento mundial
Fonte (organização):
International Monetary Fund, Balance of Payments Statistics Yearbook and data files.
Categorias:
Economy & Growth, Trade
Foi atualizado:
23 abr 2017 ano
Indicadores de alterações dos valores ao longo dos anos
Mínimo:
16.398
1 jan 2003 ano
Máximo:
41.061
1 jan 1986 ano
Na data de observação
Valor
Mudança absoluta
A alteração em relação ao valor anterior
1 jan 1973 ano
28.879
+28.879
0.0%
1 jan 1974 ano
30.38
+1.5
5.2%
1 jan 1975 ano
28.481
-1.899
-6.25%
1 jan 1976 ano
23.895
-4.586
-16.1%
1 jan 1977 ano
20.647
-3.248
-13.59%
1 jan 1978 ano
18.144
-2.504
-12.13%
1 jan 1979 ano
22.09
+3.947
21.75%
1 jan 1980 ano
25.33
+3.239
14.66%
1 jan 1981 ano
26.986
+1.656
6.54%
1 jan 1982 ano
33.388
+6.402
23.72%
1 jan 1983 ano
34.352
+0.964
2.89%
1 jan 1984 ano
32.138
-2.214
-6.45%
1 jan 1985 ano
38.421
+6.284
19.55%
1 jan 1986 ano
41.061
+2.64
6.87%
1 jan 1987 ano
30.105
-10.957
-26.68%
1 jan 1988 ano
30.645
+0.541
1.8%
1 jan 1989 ano
28.857
-1.788
-5.84%
1 jan 1990 ano
23.655
-5.202
-18.03%
1 jan 1991 ano
25.653
+1.999
8.45%
1 jan 1992 ano
18.557
-7.097
-27.66%
1 jan 1993 ano
23.034
+4.477
24.13%
1 jan 1994 ano
23.361
+0.327
1.42%
1 jan 1995 ano
22.585
-0.776
-3.32%
1 jan 1996 ano
24.501
+1.916
8.48%
1 jan 1997 ano
20.413
-4.089
-16.69%
1 jan 1998 ano
22.478
+2.066
10.12%
1 jan 1999 ano
17.009
-5.469
-24.33%
1 jan 2000 ano
17.522
+0.512
3.01%
1 jan 2001 ano
18.271
+0.749
4.28%
1 jan 2002 ano
17.495
-0.776
-4.25%
1 jan 2003 ano
16.398
-1.097
-6.27%
1 jan 2004 ano
17.346
+0.948
5.78%
1 jan 2005 ano
20.133
+2.788
16.07%
1 jan 2006 ano
19.475
-0.658
-3.27%
1 jan 2007 ano
17.606
-1.869
-9.59%
1 jan 2008 ano
18.07
+0.463
2.63%
1 jan 2009 ano
17.549
-0.521
-2.88%
1 jan 2010 ano
16.967
-0.582
-3.32%
1 jan 2011 ano
19.544
+2.577
15.19%
1 jan 2012 ano
22.265
+2.722
13.93%
1 jan 2013 ano
22.55
+0.284
1.28%
1 jan 2014 ano
22.325
-0.224
-1.0%
1 jan 2015 ano
22.43
+0.105
0.47%
1 jan 2016 ano
20.203
-2.227
-9.93%
Classificação de países por estatísticas atuais por anos


Comentários: