29
/pt/
pt
AIzaSyAYiBZKx7MnpbEhh9jyipgxe19OcubqV5w
April 1, 2024
213778
Nigeria
NGA
true
2
1
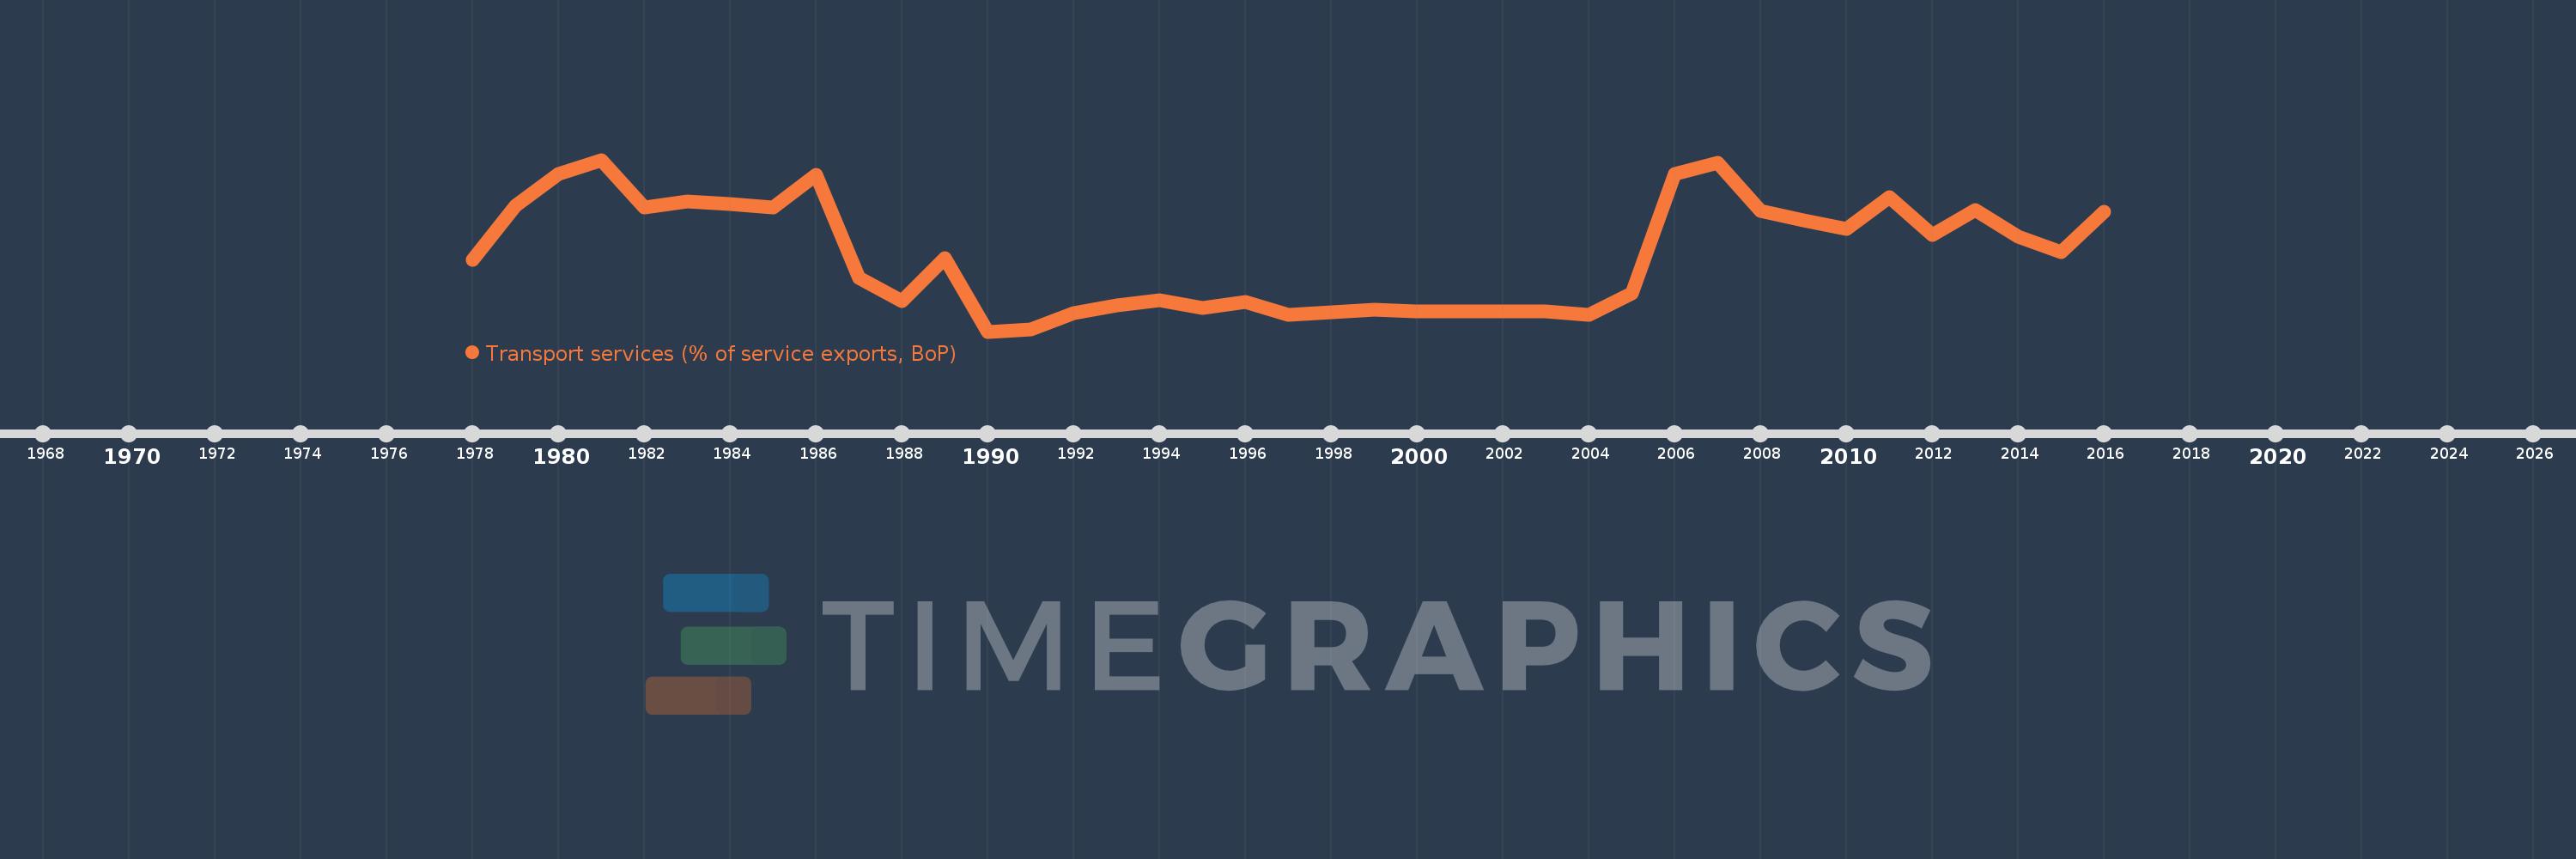
Transport services (% of service exports, BoP)
2016,2015,2014,2013,2012,2011,2010,2009,2008,2007,2006,2005,2004,2003,2002,2001,2000,1999,1998,1997,1996,1995,1994,1993,1992,1991,1990,1989,1988,1987,1986,1985,1984,1983,1982,1981,1980,1979,1978
Estas estatísticas em outros países:
AfghanistanAlbaniaAlgeriaAngolaAntigua and BarbudaArab WorldArgentinaArmeniaArubaAustraliaAustriaAzerbaijanBahamas, TheBahrainBangladeshBarbadosBelarusBelgiumBelizeBeninBermudaBhutanBoliviaBosnia and HerzegovinaBotswanaBrazilBrunei DarussalamBulgariaBurkina FasoBurundiCabo VerdeCambodiaCameroonCanadaCaribbean small statesCentral African RepublicCentral Europe and the BalticsChadChileChinaColombiaComorosCongo, Dem. Rep.Congo, Rep.Costa RicaCote d'IvoireCroatiaCuracaoCyprusCzech RepublicDenmarkDjiboutiDominicaDominican RepublicEarly-demographic dividendEast Asia & PacificEast Asia & Pacific (excluding high income)East Asia & Pacific (IDA & IBRD countries)EcuadorEgypt, Arab Rep.El SalvadorEritreaEstoniaEthiopiaEuro areaEurope & Central AsiaEurope & Central Asia (excluding high income)Europe & Central Asia (IDA & IBRD countries)European UnionFaroe IslandsFijiFinlandFragile and conflict affected situationsFranceFrench PolynesiaGabonGambia, TheGeorgiaGermanyGhanaGreeceGrenadaGuatemalaGuineaGuinea-BissauGuyanaHaitiHeavily indebted poor countries (HIPC)High incomeHondurasHong Kong SAR, ChinaHungaryIBRD onlyIcelandIDA & IBRD totalIDA onlyIDA totalIndiaIndonesiaIran, Islamic Rep.IraqIrelandIsraelItalyJamaicaJapanJordanKazakhstanKenyaKiribatiKorea, Rep.KosovoKuwaitKyrgyz RepublicLao PDRLate-demographic dividendLatin America & Caribbean Latin America & Caribbean (excluding high income)Latin America & the Caribbean (IDA & IBRD countries)LatviaLeast developed countries: UN classificationLebanonLesothoLiberiaLibyaLithuaniaLow & middle incomeLow incomeLower middle incomeLuxembourgMacao SAR, ChinaMacedonia, FYRMadagascarMalawiMalaysiaMaldivesMaliMaltaMarshall IslandsMauritaniaMauritiusMexicoMicronesia, Fed. Sts.Middle East & North AfricaMiddle East & North Africa (excluding high income)Middle East & North Africa (IDA & IBRD countries)Middle incomeMoldovaMongoliaMontenegroMoroccoMozambiqueMyanmarNamibiaNepalNetherlandsNew CaledoniaNew ZealandNicaraguaNigerNigeriaNorth AmericaNorwayOECD membersOmanOther small statesPacific island small statesPakistanPalauPanamaPapua New GuineaParaguayPeruPhilippinesPolandPortugalPost-demographic dividendPre-demographic dividendQatarRomaniaRussian FederationRwandaSamoaSao Tome and PrincipeSaudi ArabiaSenegalSerbiaSeychellesSierra LeoneSingaporeSint Maarten (Dutch part)Slovak RepublicSloveniaSmall statesSolomon IslandsSouth AfricaSouth AsiaSouth Asia (IDA & IBRD)South SudanSpainSri LankaSt. Kitts and NevisSt. LuciaSt. Vincent and the GrenadinesSub-Saharan Africa Sub-Saharan Africa (excluding high income)Sub-Saharan Africa (IDA & IBRD countries)SudanSurinameSwazilandSwedenSwitzerlandSyrian Arab RepublicTajikistanTanzaniaThailandTimor-LesteTogoTongaTrinidad and TobagoTunisiaTurkeyTuvaluUgandaUkraineUnited KingdomUnited StatesUpper middle incomeUruguayVanuatuVenezuela, RBWest Bank and GazaWorldYemen, Rep.ZambiaZimbabwe Linha do tempo:
Nesta escala de tempo está apresentado um gráfico de 1978 ano até 2016 ano Nigeria. Dados de 1977 ano ausente. O número de observações reais por data: 39.
Fonte (nome):
Indicadores de desenvolvimento mundial
Fonte (organização):
International Monetary Fund, Balance of Payments Statistics Yearbook and data files.
Categorias:
Economy & Growth, Trade
Foi atualizado:
23 abr 2017 ano
Indicadores de alterações dos valores ao longo dos anos
Mínimo:
2.879
1 jan 1990 ano
Máximo:
80.893
1 jan 1981 ano
Na data de observação
Valor
Mudança absoluta
A alteração em relação ao valor anterior
1 jan 1978 ano
35.537
+35.537
0.0%
1 jan 1979 ano
60.126
+24.588
69.19%
1 jan 1980 ano
74.532
+14.407
23.96%
1 jan 1981 ano
80.893
+6.361
8.53%
1 jan 1982 ano
59.143
-21.75
-26.89%
1 jan 1983 ano
61.842
+2.699
4.56%
1 jan 1984 ano
60.928
-0.914
-1.48%
1 jan 1985 ano
59.187
-1.741
-2.86%
1 jan 1986 ano
73.972
+14.785
24.98%
1 jan 1987 ano
27.13
-46.842
-63.32%
1 jan 1988 ano
16.911
-10.219
-37.67%
1 jan 1989 ano
36.303
+19.392
114.67%
1 jan 1990 ano
2.879
-33.424
-92.07%
1 jan 1991 ano
3.856
+0.977
33.94%
1 jan 1992 ano
11.257
+7.401
191.93%
1 jan 1993 ano
14.595
+3.339
29.66%
1 jan 1994 ano
17.175
+2.58
17.67%
1 jan 1995 ano
13.631
-3.544
-20.64%
1 jan 1996 ano
16.404
+2.774
20.35%
1 jan 1997 ano
10.42
-5.984
-36.48%
1 jan 1998 ano
11.549
+1.129
10.84%
1 jan 1999 ano
12.835
+1.286
11.14%
1 jan 2000 ano
12.032
-0.803
-6.26%
1 jan 2001 ano
12.03
-0.002
-0.02%
1 jan 2002 ano
12.03
0.0
0.0%
1 jan 2003 ano
12.03
+0.0
0.0%
1 jan 2004 ano
10.405
-1.625
-13.51%
1 jan 2005 ano
20.168
+9.763
93.83%
1 jan 2006 ano
74.613
+54.445
269.95%
1 jan 2007 ano
79.473
+4.86
6.51%
1 jan 2008 ano
57.494
-21.98
-27.66%
1 jan 2009 ano
53.413
-4.081
-7.1%
1 jan 2010 ano
49.518
-3.895
-7.29%
1 jan 2011 ano
63.944
+14.425
29.13%
1 jan 2012 ano
46.874
-17.069
-26.69%
1 jan 2013 ano
58.091
+11.216
23.93%
1 jan 2014 ano
45.876
-12.215
-21.03%
1 jan 2015 ano
38.887
-6.989
-15.23%
1 jan 2016 ano
57.216
+18.329
47.13%
Classificação de países por estatísticas atuais por anos


Comentários: