29
/pt/
pt
AIzaSyAYiBZKx7MnpbEhh9jyipgxe19OcubqV5w
April 1, 2024
33481
European Union
EUU
false
2
1
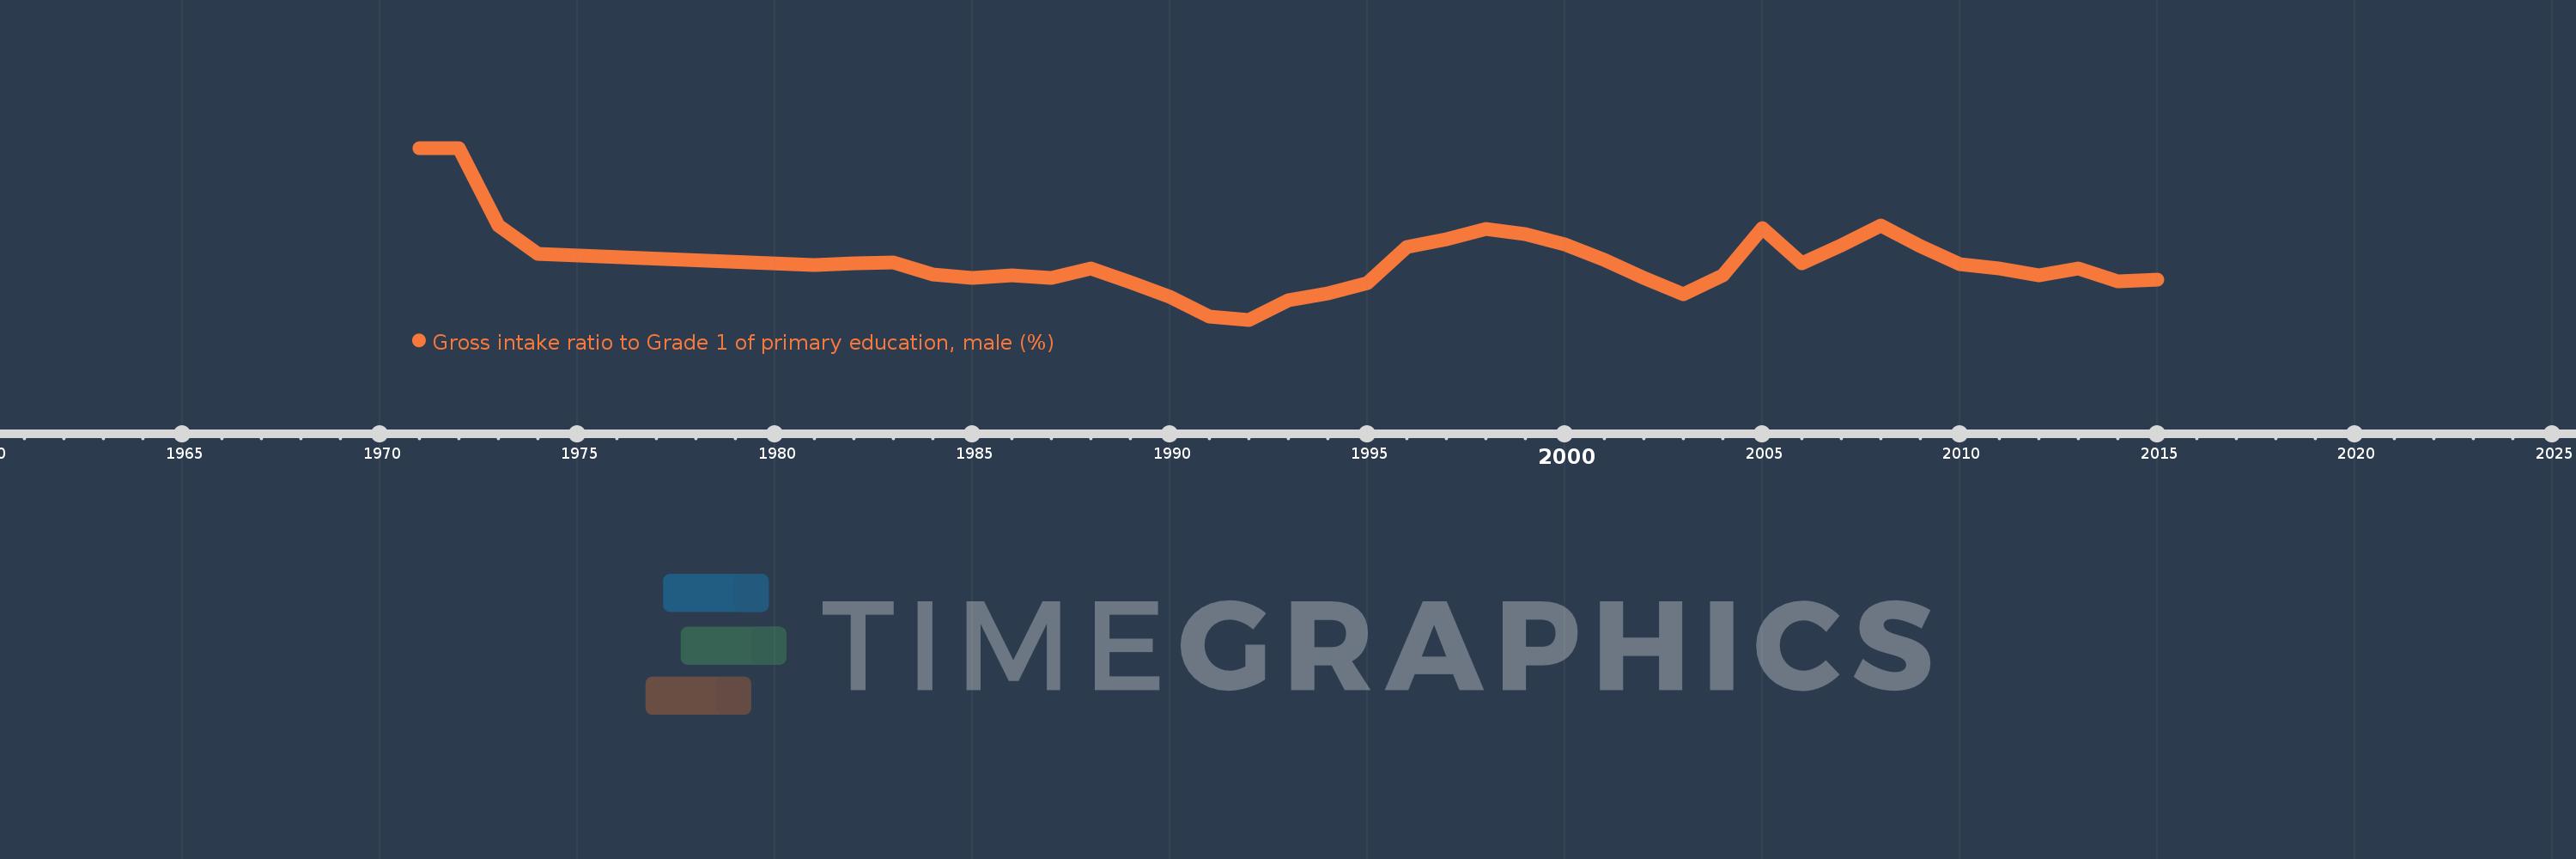
Gross intake ratio to Grade 1 of primary education, male (%)
2015,2014,2013,2012,2011,2010,2009,2008,2007,2006,2005,2004,2003,2002,2001,2000,1999,1998,1997,1996,1995,1994,1993,1992,1991,1990,1989,1988,1987,1986,1985,1984,1983,1982,1981,1974,1973,1972,1971
Estas estatísticas em outros países:
AfghanistanAlbaniaAlgeriaAngolaAntigua and BarbudaArab WorldArgentinaArmeniaArubaAustriaAzerbaijanBahamas, TheBahrainBangladeshBarbadosBelarusBelgiumBelizeBeninBermudaBhutanBoliviaBosnia and HerzegovinaBotswanaBrazilBrunei DarussalamBulgariaBurkina FasoBurundiCabo VerdeCambodiaCameroonCanadaCaribbean small statesCentral African RepublicCentral Europe and the BalticsChadChileChinaColombiaComorosCongo, Dem. Rep.Congo, Rep.Costa RicaCote d'IvoireCroatiaCubaCyprusCzech RepublicDenmarkDjiboutiDominicaDominican RepublicEarly-demographic dividendEast Asia & PacificEast Asia & Pacific (excluding high income)East Asia & Pacific (IDA & IBRD countries)EcuadorEgypt, Arab Rep.El SalvadorEquatorial GuineaEritreaEstoniaEthiopiaEuro areaEurope & Central AsiaEurope & Central Asia (excluding high income)Europe & Central Asia (IDA & IBRD countries)European UnionFijiFinlandFragile and conflict affected situationsFranceGabonGambia, TheGeorgiaGermanyGhanaGreeceGrenadaGuatemalaGuineaGuinea-BissauGuyanaHaitiHeavily indebted poor countries (HIPC)High incomeHondurasHong Kong SAR, ChinaHungaryIBRD onlyIcelandIDA & IBRD totalIDA blendIDA onlyIDA totalIndiaIndonesiaIran, Islamic Rep.IraqIrelandIsraelItalyJamaicaJapanJordanKazakhstanKenyaKiribatiKorea, Dem. People’s Rep.Korea, Rep.KuwaitKyrgyz RepublicLao PDRLate-demographic dividendLatin America & Caribbean Latin America & Caribbean (excluding high income)Latin America & the Caribbean (IDA & IBRD countries)LatviaLeast developed countries: UN classificationLebanonLesothoLiberiaLibyaLiechtensteinLithuaniaLow & middle incomeLow incomeLower middle incomeLuxembourgMacao SAR, ChinaMacedonia, FYRMadagascarMalawiMaldivesMaliMaltaMarshall IslandsMauritaniaMauritiusMexicoMicronesia, Fed. Sts.Middle East & North AfricaMiddle East & North Africa (excluding high income)Middle East & North Africa (IDA & IBRD countries)Middle incomeMoldovaMongoliaMontenegroMoroccoMozambiqueMyanmarNamibiaNauruNepalNetherlandsNew ZealandNicaraguaNigerNigeriaNorth AmericaNorwayOECD membersOmanOther small statesPacific island small statesPakistanPalauPanamaPapua New GuineaParaguayPeruPhilippinesPolandPortugalPost-demographic dividendPre-demographic dividendPuerto RicoQatarRomaniaRussian FederationRwandaSamoaSan MarinoSao Tome and PrincipeSaudi ArabiaSenegalSerbiaSeychellesSierra LeoneSlovak RepublicSloveniaSmall statesSolomon IslandsSouth AfricaSouth AsiaSouth Asia (IDA & IBRD)South SudanSpainSri LankaSt. Kitts and NevisSt. LuciaSt. Vincent and the GrenadinesSub-Saharan Africa Sub-Saharan Africa (excluding high income)Sub-Saharan Africa (IDA & IBRD countries)SudanSurinameSwazilandSwedenSwitzerlandSyrian Arab RepublicTajikistanTanzaniaThailandTimor-LesteTogoTongaTrinidad and TobagoTunisiaTurkeyTuvaluUgandaUkraineUnited Arab EmiratesUnited StatesUpper middle incomeUruguayUzbekistanVanuatuVenezuela, RBVietnamWest Bank and GazaWorldYemen, Rep.ZambiaZimbabwe Linha do tempo:
Nesta escala de tempo está apresentado um gráfico de 1971 ano até 2015 ano European Union. Dados de 1970 ano ausente. O número de observações reais por data: 39.
Fonte (nome):
Indicadores de desenvolvimento mundial
Fonte (organização):
UNESCO Institute for Statistics
Categorias:
Education, Gender
Foi atualizado:
23 abr 2017 ano
Indicadores de alterações dos valores ao longo dos anos
Mínimo:
97.724
1 jan 1992 ano
Máximo:
106.35
1 jan 1972 ano
Na data de observação
Valor
Mudança absoluta
A alteração em relação ao valor anterior
1 jan 1971 ano
106.316
+106.316
0.0%
1 jan 1972 ano
106.35
+0.034
0.03%
1 jan 1973 ano
102.455
-3.895
-3.66%
1 jan 1974 ano
101.034
-1.421
-1.39%
1 jan 1981 ano
100.472
-0.562
-0.56%
1 jan 1982 ano
100.556
+0.084
0.08%
1 jan 1983 ano
100.613
+0.057
0.06%
1 jan 1984 ano
99.996
-0.617
-0.61%
1 jan 1985 ano
99.821
-0.175
-0.18%
1 jan 1986 ano
99.965
+0.145
0.14%
1 jan 1987 ano
99.827
-0.138
-0.14%
1 jan 1988 ano
100.303
+0.476
0.48%
1 jan 1989 ano
99.624
-0.679
-0.68%
1 jan 1990 ano
98.863
-0.761
-0.76%
1 jan 1991 ano
97.896
-0.968
-0.98%
1 jan 1992 ano
97.724
-0.172
-0.18%
1 jan 1993 ano
98.711
+0.987
1.01%
1 jan 1994 ano
99.066
+0.355
0.36%
1 jan 1995 ano
99.551
+0.486
0.49%
1 jan 1996 ano
101.359
+1.808
1.82%
1 jan 1997 ano
101.785
+0.426
0.42%
1 jan 1998 ano
102.288
+0.503
0.49%
1 jan 1999 ano
102.018
-0.27
-0.26%
1 jan 2000 ano
101.527
-0.491
-0.48%
1 jan 2001 ano
100.716
-0.811
-0.8%
1 jan 2002 ano
99.817
-0.899
-0.89%
1 jan 2003 ano
99.007
-0.81
-0.81%
1 jan 2004 ano
99.96
+0.953
0.96%
1 jan 2005 ano
102.328
+2.368
2.37%
1 jan 2006 ano
100.542
-1.786
-1.75%
1 jan 2007 ano
101.459
+0.917
0.91%
1 jan 2008 ano
102.472
+1.013
1.0%
1 jan 2009 ano
101.406
-1.066
-1.04%
1 jan 2010 ano
100.508
-0.898
-0.89%
1 jan 2011 ano
100.289
-0.219
-0.22%
1 jan 2012 ano
99.963
-0.326
-0.32%
1 jan 2013 ano
100.301
+0.338
0.34%
1 jan 2014 ano
99.667
-0.634
-0.63%
1 jan 2015 ano
99.759
+0.093
0.09%
Classificação de países por estatísticas atuais por anos


Comentários: