29
/pt/
pt
AIzaSyAYiBZKx7MnpbEhh9jyipgxe19OcubqV5w
April 1, 2024
218407
Panama
PAN
true
2
1
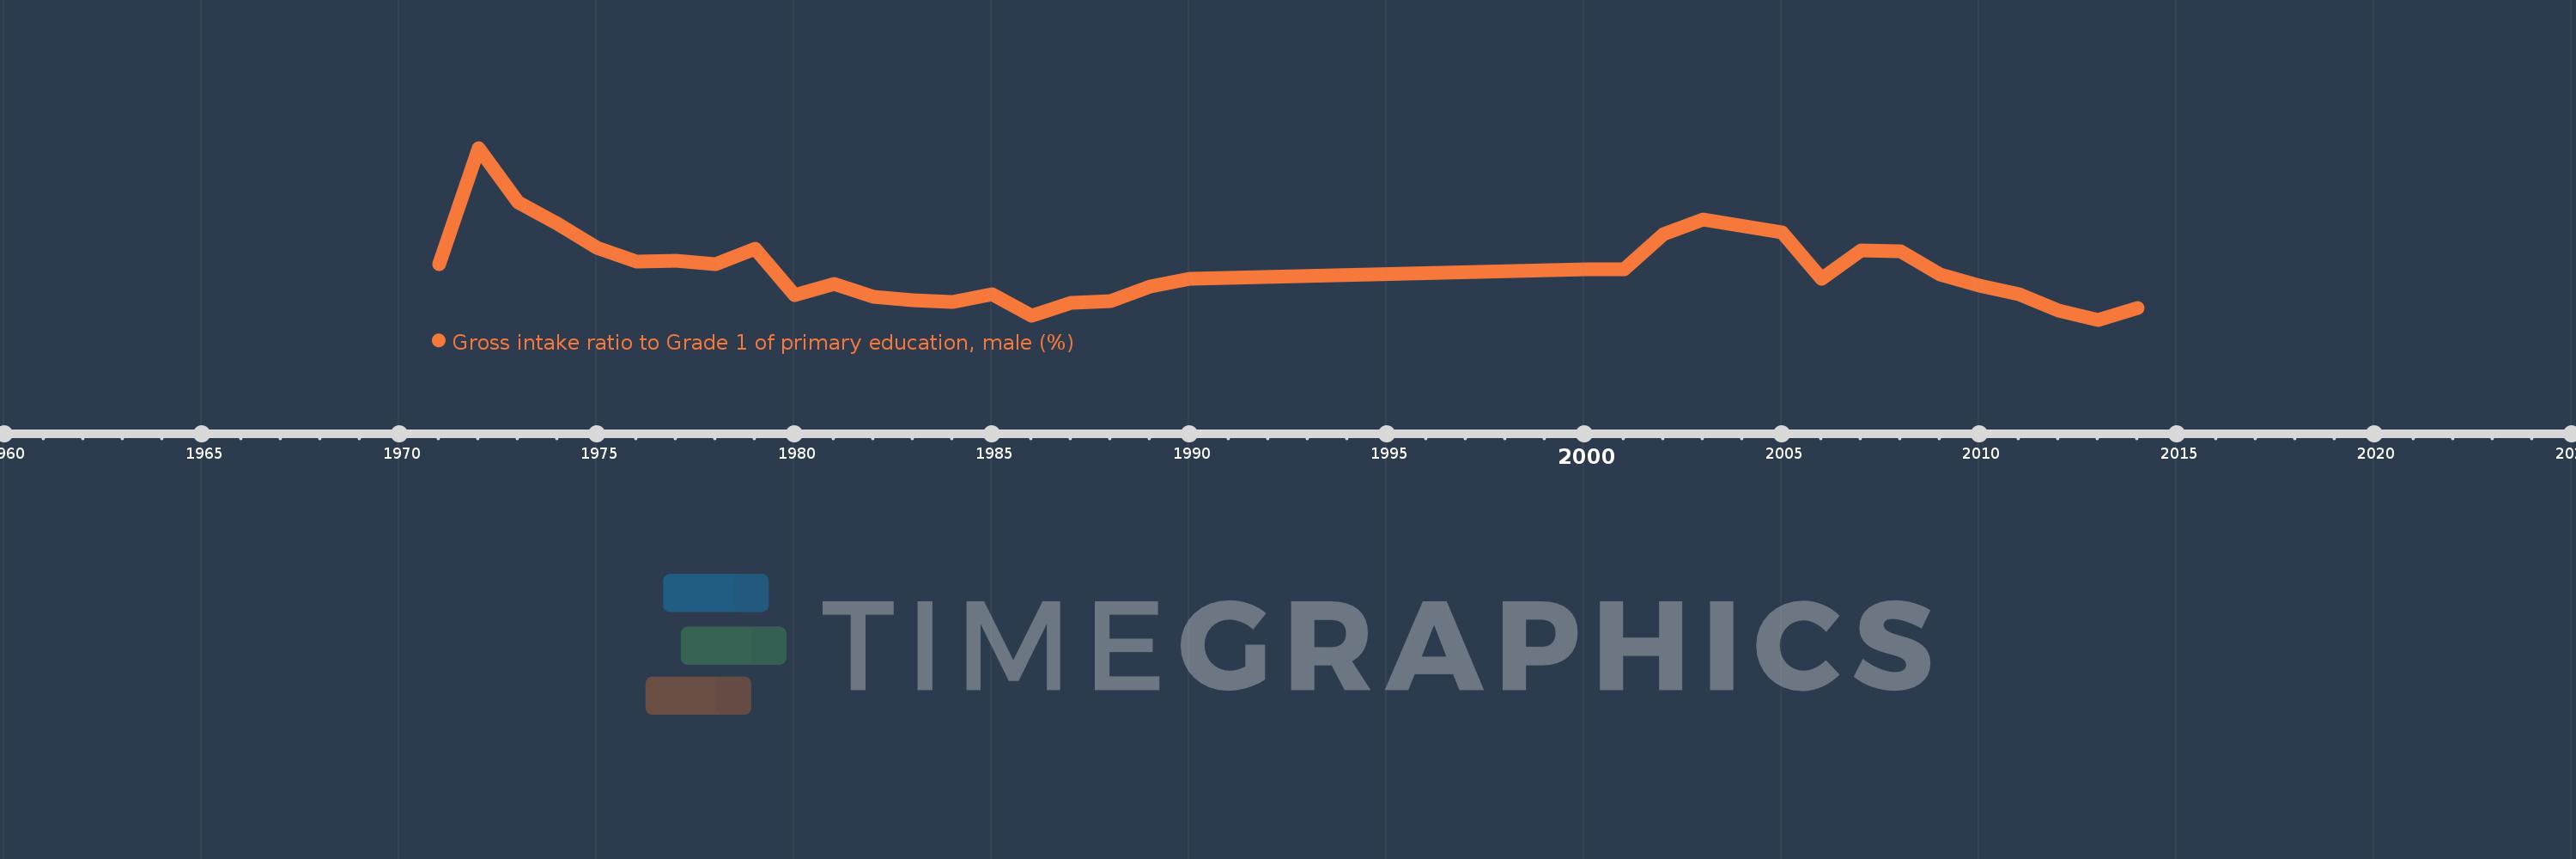
Gross intake ratio to Grade 1 of primary education, male (%)
2014,2013,2012,2011,2010,2009,2008,2007,2006,2005,2003,2002,2001,2000,1990,1989,1988,1987,1986,1985,1984,1983,1982,1981,1980,1979,1978,1977,1976,1975,1974,1973,1972,1971
Estas estatísticas em outros países:
AfghanistanAlbaniaAlgeriaAngolaAntigua and BarbudaArab WorldArgentinaArmeniaArubaAustriaAzerbaijanBahamas, TheBahrainBangladeshBarbadosBelarusBelgiumBelizeBeninBermudaBhutanBoliviaBosnia and HerzegovinaBotswanaBrazilBrunei DarussalamBulgariaBurkina FasoBurundiCabo VerdeCambodiaCameroonCanadaCaribbean small statesCentral African RepublicCentral Europe and the BalticsChadChileChinaColombiaComorosCongo, Dem. Rep.Congo, Rep.Costa RicaCote d'IvoireCroatiaCubaCyprusCzech RepublicDenmarkDjiboutiDominicaDominican RepublicEarly-demographic dividendEast Asia & PacificEast Asia & Pacific (excluding high income)East Asia & Pacific (IDA & IBRD countries)EcuadorEgypt, Arab Rep.El SalvadorEquatorial GuineaEritreaEstoniaEthiopiaEuro areaEurope & Central AsiaEurope & Central Asia (excluding high income)Europe & Central Asia (IDA & IBRD countries)European UnionFijiFinlandFragile and conflict affected situationsFranceGabonGambia, TheGeorgiaGermanyGhanaGreeceGrenadaGuatemalaGuineaGuinea-BissauGuyanaHaitiHeavily indebted poor countries (HIPC)High incomeHondurasHong Kong SAR, ChinaHungaryIBRD onlyIcelandIDA & IBRD totalIDA blendIDA onlyIDA totalIndiaIndonesiaIran, Islamic Rep.IraqIrelandIsraelItalyJamaicaJapanJordanKazakhstanKenyaKiribatiKorea, Dem. People’s Rep.Korea, Rep.KuwaitKyrgyz RepublicLao PDRLate-demographic dividendLatin America & Caribbean Latin America & Caribbean (excluding high income)Latin America & the Caribbean (IDA & IBRD countries)LatviaLeast developed countries: UN classificationLebanonLesothoLiberiaLibyaLiechtensteinLithuaniaLow & middle incomeLow incomeLower middle incomeLuxembourgMacao SAR, ChinaMacedonia, FYRMadagascarMalawiMaldivesMaliMaltaMarshall IslandsMauritaniaMauritiusMexicoMicronesia, Fed. Sts.Middle East & North AfricaMiddle East & North Africa (excluding high income)Middle East & North Africa (IDA & IBRD countries)Middle incomeMoldovaMongoliaMontenegroMoroccoMozambiqueMyanmarNamibiaNauruNepalNetherlandsNew ZealandNicaraguaNigerNigeriaNorth AmericaNorwayOECD membersOmanOther small statesPacific island small statesPakistanPalauPanamaPapua New GuineaParaguayPeruPhilippinesPolandPortugalPost-demographic dividendPre-demographic dividendPuerto RicoQatarRomaniaRussian FederationRwandaSamoaSan MarinoSao Tome and PrincipeSaudi ArabiaSenegalSerbiaSeychellesSierra LeoneSlovak RepublicSloveniaSmall statesSolomon IslandsSouth AfricaSouth AsiaSouth Asia (IDA & IBRD)South SudanSpainSri LankaSt. Kitts and NevisSt. LuciaSt. Vincent and the GrenadinesSub-Saharan Africa Sub-Saharan Africa (excluding high income)Sub-Saharan Africa (IDA & IBRD countries)SudanSurinameSwazilandSwedenSwitzerlandSyrian Arab RepublicTajikistanTanzaniaThailandTimor-LesteTogoTongaTrinidad and TobagoTunisiaTurkeyTuvaluUgandaUkraineUnited Arab EmiratesUnited StatesUpper middle incomeUruguayUzbekistanVanuatuVenezuela, RBVietnamWest Bank and GazaWorldYemen, Rep.ZambiaZimbabwe Linha do tempo:
Nesta escala de tempo está apresentado um gráfico de 1971 ano até 2014 ano Panama. Dados de 1970 ano ausente. O número de observações reais por data: 34.
Fonte (nome):
Indicadores de desenvolvimento mundial
Fonte (organização):
UNESCO Institute for Statistics
Categorias:
Education, Gender
Foi atualizado:
23 abr 2017 ano
Indicadores de alterações dos valores ao longo dos anos
Mínimo:
98.724
1 jan 2013 ano
Máximo:
134.623
1 jan 1972 ano
Na data de observação
Valor
Mudança absoluta
A alteração em relação ao valor anterior
1 jan 1971 ano
110.394
+110.394
0.0%
1 jan 1972 ano
134.623
+24.228
21.95%
1 jan 1973 ano
123.191
-11.432
-8.49%
1 jan 1974 ano
118.722
-4.469
-3.63%
1 jan 1975 ano
113.834
-4.888
-4.12%
1 jan 1976 ano
110.952
-2.882
-2.53%
1 jan 1977 ano
111.019
+0.067
0.06%
1 jan 1978 ano
110.268
-0.751
-0.68%
1 jan 1979 ano
113.558
+3.291
2.98%
1 jan 1980 ano
103.936
-9.622
-8.47%
1 jan 1981 ano
106.22
+2.284
2.2%
1 jan 1982 ano
103.524
-2.696
-2.54%
1 jan 1983 ano
102.716
-0.809
-0.78%
1 jan 1984 ano
102.382
-0.333
-0.32%
1 jan 1985 ano
103.983
+1.601
1.56%
1 jan 1986 ano
99.543
-4.441
-4.27%
1 jan 1987 ano
102.262
+2.719
2.73%
1 jan 1988 ano
102.654
+0.392
0.38%
1 jan 1989 ano
105.603
+2.949
2.87%
1 jan 1990 ano
107.357
+1.754
1.66%
1 jan 2000 ano
109.271
+1.914
1.78%
1 jan 2001 ano
109.214
-0.057
-0.05%
1 jan 2002 ano
116.705
+7.491
6.86%
1 jan 2003 ano
119.705
+3.0
2.57%
1 jan 2005 ano
116.902
-2.803
-2.34%
1 jan 2006 ano
107.324
-9.578
-8.19%
1 jan 2007 ano
113.153
+5.829
5.43%
1 jan 2008 ano
112.99
-0.163
-0.14%
1 jan 2009 ano
108.116
-4.874
-4.31%
1 jan 2010 ano
105.793
-2.322
-2.15%
1 jan 2011 ano
104.042
-1.752
-1.66%
1 jan 2012 ano
100.676
-3.366
-3.24%
1 jan 2013 ano
98.724
-1.952
-1.94%
1 jan 2014 ano
101.151
+2.427
2.46%
Classificação de países por estatísticas atuais por anos


Comentários: